Lexmark 2007 Annual Report Download - page 44
Download and view the complete annual report
Please find page 44 of the 2007 Lexmark annual report below. You can navigate through the pages in the report by either clicking on the pages listed below, or by using the keyword search tool below to find specific information within the annual report.-
 1
1 -
2
-
3
-
4
-
5
-
6
-
7
-
8
-
9
-
10
-
11
-
12
-
13
-
14
-
15
-
16
-
17
-
18
-
19
-
20
-
21
-
22
-
23
-
24
-
25
-
26
-
27
-
28
-
29
-
30
-
31
-
32
-
33
-
 34
34 -
 35
35 -
 36
36 -
 37
37 -
 38
38 -
 39
39 -
 40
40 -
 41
41 -
 42
42 -
 43
43 -
 44
44 -
 45
45 -
 46
46 -
 47
47 -
 48
48 -
 49
49 -
 50
50 -
 51
51 -
 52
52 -
 53
53 -
 54
54 -
55
-
56
-
57
-
58
-
59
-
60
-
61
-
62
-
63
-
64
-
65
-
66
-
67
-
68
-
69
-
70
-
71
-
72
-
73
-
74
-
75
-
76
-
77
-
78
-
79
-
80
-
81
-
82
-
83
-
84
-
85
-
86
-
87
-
88
-
89
-
90
-
91
-
92
-
93
-
94
-
95
-
96
-
97
-
98
-
99
-
100
-
101
-
102
-
103
-
104
-
105
-
106
-
107
-
108
-
109
-
110
-
111
-
112
-
113
 |
 |

Research and development increased in 2007 and 2006 compared to the prior year due to the Company’s
continued investment to support product and solution development. These continuing investments have
led to new products and solutions aimed at targeted growth segments.
Selling, general and administrative (“SG&A”) expenses in 2007 increased YTYas the Company continued
to increase spending on marketing and sales activities. During 2007, demand generation activities, which
include the brand development marketing campaign launched in late 2006, increased YTY. The initiative
includes a television advertising campaign along with radio and print advertising in targeted geographic
and market segments. Additionally, SG&A expenses in 2007 included $9.3 million of project costs (net of a
$3.5 million pre-tax gain on the sale of the Rosyth, Scotland facility). SG&A expenses in 2006 included
$11.9 million of project costs related to the 2006 actions. See “Restructuring-related Charges, Project
Costs and Other” that follows for further discussion. SG&A expenses in 2007 and 2006 also included
$31.7 million and $30.3 million of stock-based compensation expense due to the Company’s adoption of
SFAS 123R.
Restructuring and other, net, in 2007 included $25.7 million of restructuring-related charges in connection
with the 2007 Restructuring Plan. Restructuring and other, net, in 2006 included $81.1 million of
restructuring-related charges for the 2006 restructuring plan partially offset by a $9.9 million pension
curtailment gain. In 2005, the Company incurred $10.4 million of one-time termination benefit charges
related to the 2005 workforce reduction. See “Restructuring-related Charges, Project Costs and Other”
that follows for further discussion.
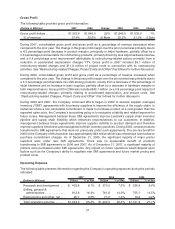
Operating Income (Loss)
The following table provides operating income by market segment:
(Dollars in Millions) 2007 2006 Change 2006 2005 Change
Business . . . . . . . . . . . . . . . . . . . . $ 612.0 $ 600.1 2% $ 600.1 $ 661.0 (9)%
% of segment revenue ........ 20.4% 20.9% (0.5)pts 20.9% 23.8% (2.9)pts
Consumer . . . . . . . . . . . . . . . . . . . 93.4 246.0 (62)% $ 246.0 232.1 6%
% of segment revenue ........ 4.7% 11.0% (6.3)pts 11.0% 9.5% 1.5pts
All other . . . . . . . . . . . . . . . . . . . . . (384.1) (403.6) 5% $(403.6) (359.4) (12)%
Total operating income (loss) . . . . . $ 321.3 $ 442.5 (27)% $ 442.5 $ 533.7 (17)%
% of total revenue ........... 6.5% 8.7% (2.2)pts 8.7% 10.2% (1.5)pts
For the year ended December 31, 2007, the decrease in consolidated operating income was due to
decreased gross profits and higher operating expenses partially offset by a reduction in restructuring-
related charges and project costs YTY as discussed above. Operating income for the Business segment
increased YTYas higher gross profits, reflecting increased supplies revenue, were partially offset by higher
operating expense, reflecting higher marketing and sales and product development investments.
Operating income for the Consumer segment decreased YTY due to lower supplies revenue, lower
product margins and increased operating expenses.
For the year ended December 31, 2006, the decrease in consolidated operating income was due to
increased operating expenses partially offset by increased gross profits. Operating income for the
Business segment decreased due to lower gross profits, the impact of restructuring-related charges
and project costs and the increased investment in research and development. Operating income for the
Consumer segment increased due to increased gross profits partially offset by the impact of restructuring-
related charges and project costs.
During 2007, the Company incurred total pre-tax restructuring-related charges and project costs of
$12.1 million in its Business segment, $12.2 million in its Consumer segment and $27.7 million in All
other. During 2006, the Company incurred restructuring-related charges and project costs of $35.9 million
in its Business segment, $57.2 million in its Consumer segment and $42.0 million in All other. All other
operating income in 2006 also included a $9.9 million pension curtailment gain. During 2005, the Company
38