Kohl's 2011 Annual Report Download - page 68
Download and view the complete annual report
Please find page 68 of the 2011 Kohl's annual report below. You can navigate through the pages in the report by either clicking on the pages listed below, or by using the keyword search tool below to find specific information within the annual report.-
 1
1 -
2
-
3
-
4
-
5
-
6
-
7
-
8
-
9
-
10
-
11
-
12
-
13
-
14
-
15
-
16
-
17
-
18
-
19
-
20
-
21
-
22
-
23
-
24
-
25
-
26
-
27
-
28
-
29
-
30
-
31
-
32
-
33
-
34
-
35
-
36
-
37
-
38
-
39
-
40
-
41
-
42
-
43
-
44
-
45
-
46
-
47
-
48
-
49
-
50
-
51
-
52
-
53
-
54
-
55
-
56
-
57
-
 58
58 -
 59
59 -
 60
60 -
 61
61 -
 62
62 -
 63
63 -
 64
64 -
 65
65 -
 66
66 -
 67
67 -
 68
68 -
 69
69 -
 70
70 -
 71
71 -
 72
72 -
 73
73 -
 74
74 -
 75
75 -
 76
76 -
 77
77 -
 78
78 -
79
-
80
 |
 |

KOHL’S CORPORATION
NOTES TO CONSOLIDATED FINANCIAL STATEMENTS—(Continued)
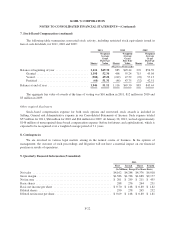
7. Stock-Based Compensation (continued)
The following table summarizes nonvested stock activity, including restricted stock equivalents issued in
lieu of cash dividends, for 2011, 2010 and 2009:
2011 2010 2009
Shares
Weighted
Average
Grant
Date Fair
Value Shares
Weighted
Average
Grant
Date Fair
Value Shares
Weighted
Average
Grant
Date Fair
Value
(Shares in Thousands)
Balance at beginning of year ...................... 1,116 $49.30 883 $45.44 276 $54.39
Granted ................................... 1,198 52.34 498 55.24 715 43.04
Vested .................................... (308) 49.28 (219) 47.52 (76) 57.13
Forfeited .................................. (60) 51.31 (46) 47.75 (32) 42.51
Balance at end of year ........................... 1,946 51.11 1,116 $49.30 883 $45.44
The aggregate fair value of awards at the time of vesting was $16 million in 2011, $12 million in 2010 and
$3 million in 2009.
Other required disclosures
Stock-based compensation expense for both stock options and nonvested stock awards is included in
Selling, General and Administrative expense in our Consolidated Statements of Income. Such expense totaled
$57 million for 2011, $66 million for 2010 and $64 million for 2009. At January 28, 2012, we had approximately
$146 million of unrecognized share-based compensation expense (before forfeitures and capitalization), which is
expected to be recognized over a weighted average period of 3.1 years.
8. Contingencies
We are involved in various legal matters arising in the normal course of business. In the opinion of
management, the outcome of such proceedings and litigation will not have a material impact on our financial
position or results of operations.
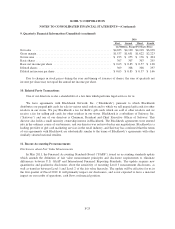
9. Quarterly Financial Information (Unaudited)
2011
First Second Third Fourth
(In Millions, Except Per Share Data)
Net sales ..................................................... $4,162 $4,248 $4,376 $6,018
Gross margin .................................................. $1,586 $1,728 $1,688 $2,177
Net income ................................................... $ 201 $ 299 $ 211 $ 455
Basic shares ................................................... 288 276 264 251
Basic net income per share ....................................... $ 0.70 $ 1.08 $ 0.80 $ 1.82
Diluted shares ................................................. 290 278 265 252
Diluted net income per share ...................................... $ 0.69 $ 1.08 $ 0.80 $ 1.81
F-22