Kohl's 2011 Annual Report Download - page 19
Download and view the complete annual report
Please find page 19 of the 2011 Kohl's annual report below. You can navigate through the pages in the report by either clicking on the pages listed below, or by using the keyword search tool below to find specific information within the annual report.-
 1
1 -
2
-
3
-
4
-
5
-
6
-
7
-
8
-
 9
9 -
 10
10 -
 11
11 -
 12
12 -
 13
13 -
 14
14 -
 15
15 -
 16
16 -
 17
17 -
 18
18 -
 19
19 -
 20
20 -
 21
21 -
 22
22 -
 23
23 -
 24
24 -
 25
25 -
 26
26 -
 27
27 -
 28
28 -
 29
29 -
30
-
31
-
32
-
33
-
34
-
35
-
36
-
37
-
38
-
39
-
40
-
41
-
42
-
43
-
44
-
45
-
46
-
47
-
48
-
49
-
50
-
51
-
52
-
53
-
54
-
55
-
56
-
57
-
58
-
59
-
60
-
61
-
62
-
63
-
64
-
65
-
66
-
67
-
68
-
69
-
70
-
71
-
72
-
73
-
74
-
75
-
76
-
77
-
78
-
79
-
80
 |
 |
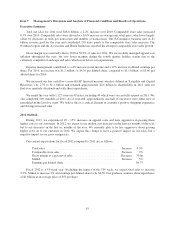
Item 7. Management’s Discussion and Analysis of Financial Condition and Results of Operations
Executive Summary
Total net sales for 2011 were $18.8 billion, a 2.2% increase over 2010. Comparable store sales increased
0.5% over 2010. Comparable sales were driven by a 6.6% increase in average unit retail price, which was largely
offset by decreases in units per transaction and number of transactions. Our E-Commerce business met its $1
billion revenue goal for the year and contributed 150 basis points to the comparable store sales increase. The
Northeast region and the Accessories and Home businesses reported the strongest comparable store sales growth.
Gross margin was essentially flat to 2010 at 38.2% of sales for 2011. We successfully managed apparel cost
inflation throughout the year, but saw lower margins during the fourth quarter holiday season due to the
extremely competitive landscape and sales which were below our expectations.
Expense management contributed to a 4% increase in net income and a 17% increase in diluted earnings per
share. For 2011, net income was $1.2 billion, or $4.30 per diluted share, compared to $1.1 billion, or $3.66 per
diluted share for 2010.
We increased our free cash flow (a non-GAAP financial measure which is defined in “Liquidity and Capital
Resources”) by 27% to $1.1 billion and returned approximately $2.6 billion to shareholders in 2011 with our
first-ever quarterly dividends and with share repurchases.
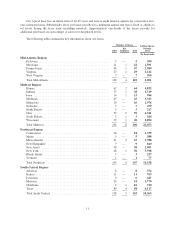
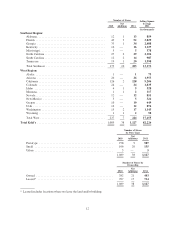
We ended the year with 1,127 stores in 49 states, including 40 which were successfully opened in 2011. We
also completed 100 remodels in 2011. As of year-end, approximately one-half of our stores were either new or
remodeled in the last five years. We believe this is a critical element in creating a positive shopping experience
and driving increased sales.
2012 Outlook
During 2011, we experienced 10 – 15% increases in apparel costs and were aggressive in passing these
higher costs to our customers. In 2012, we expect to see modest cost increases in the first six months of the year,
but to see decreases in the last six months of the year. We currently plan to be less aggressive about passing
higher costs on to our customer in 2012. We expect this change to have a positive impact on our sales, but a
negative impact on our gross margin rate.
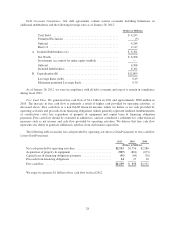
Our current expectations for fiscal 2012 compared to 2011 are as follows:
Total sales ................................................ Increase 4.5%
Comparable store sales ...................................... Increase 2%
Gross margin as a percent of sales ............................. Decrease 70 bp
SG&A ................................................... Increase 3%
Earnings per diluted share .................................... $4.75
Fiscal 2012 is a 53-week year. Excluding the impact of the 53rd week, we expect total sales to increase
3.5%, SG&A to increase 2% and earnings per diluted share to be $4.65. Our guidance assumes share repurchases
of $1 billion at an average price of $55 per share.
19