Kohl's 2011 Annual Report Download - page 18
Download and view the complete annual report
Please find page 18 of the 2011 Kohl's annual report below. You can navigate through the pages in the report by either clicking on the pages listed below, or by using the keyword search tool below to find specific information within the annual report.-
 1
1 -
2
-
3
-
4
-
5
-
6
-
7
-
 8
8 -
 9
9 -
 10
10 -
 11
11 -
 12
12 -
 13
13 -
 14
14 -
 15
15 -
 16
16 -
 17
17 -
 18
18 -
 19
19 -
 20
20 -
 21
21 -
 22
22 -
 23
23 -
 24
24 -
 25
25 -
 26
26 -
 27
27 -
 28
28 -
29
-
30
-
31
-
32
-
33
-
34
-
35
-
36
-
37
-
38
-
39
-
40
-
41
-
42
-
43
-
44
-
45
-
46
-
47
-
48
-
49
-
50
-
51
-
52
-
53
-
54
-
55
-
56
-
57
-
58
-
59
-
60
-
61
-
62
-
63
-
64
-
65
-
66
-
67
-
68
-
69
-
70
-
71
-
72
-
73
-
74
-
75
-
76
-
77
-
78
-
79
-
80
 |
 |

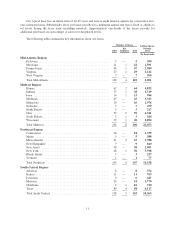
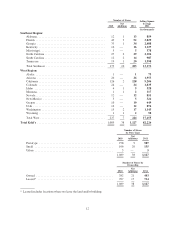
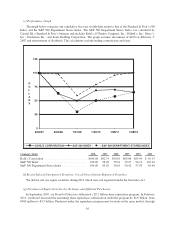
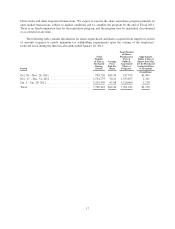
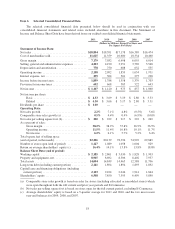
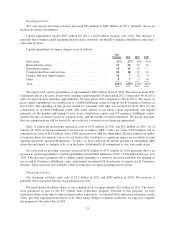
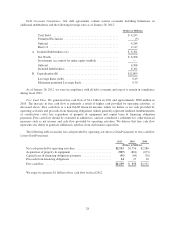
Item 6. Selected Consolidated Financial Data
The selected consolidated financial data presented below should be read in conjunction with our
consolidated financial statements and related notes included elsewhere in this document. The Statement of
Income and Balance Sheet Data have been derived from our audited consolidated financial statements.
2011 2010 2009 2008 2007
(Dollars in Millions, Except Per Share and
Per Square Foot Data)
Statement of Income Data:
Net sales ..................................... $18,804 $18,391 $17,178 $16,389 $16,474
Cost of merchandise sold ........................ 11,625 11,359 10,680 10,334 10,460
Gross margin ................................. 7,179 7,032 6,498 6,055 6,014
Selling, general and administrative expenses ......... 4,243 4,190 3,951 3,769 3,548
Depreciation and amortization .................... 778 750 688 632 535
Operating income .............................. 2,158 2,092 1,859 1,654 1,931
Interest expense, net ............................ 299 304 301 275 228
Income before income taxes ...................... 1,859 1,788 1,558 1,379 1,703
Provision for income taxes ....................... 692 668 585 522 643
Net income ................................... $ 1,167 $ 1,120 $ 973 $ 857 $ 1,060
Net income per share:
Basic .................................... $ 4.33 $ 3.69 $ 3.19 $ 2.80 $ 3.33
Diluted .................................. $ 4.30 $ 3.66 $ 3.17 $ 2.80 $ 3.31
Dividends per share ............................ $ 1.00 ————
Operating Data:
Net sales growth ............................... 2.2% 7.1% 4.8% (0.5%) 5.6%
Comparable store sales growth (a) ................. 0.5% 4.4% 0.4% (6.9%) (0.8)%
Net sales per selling square foot (b) ................ $ 220 $ 222 $ 217 $ 222 $ 249
As a percent of sales:
Gross margin ............................. 38.2% 38.2% 37.8% 36.9% 36.5%
Operating income .......................... 11.5% 11.4% 10.8% 10.1% 11.7%
Net income ............................... 6.2% 6.1% 5.7% 5.2% 6.4%
Total square feet of selling space
(end of period, in thousands) ..................... 82,226 80,139 78,396 74,992 69,889
Number of stores open (end of period) ............. 1,127 1,089 1,058 1,004 929
Return on average shareholders’ equity (c) .......... 16.4% 14.1% 13.8% 13.8% 18.8%
Balance Sheet Data (end of period):
Working capital ............................... $ 2,185 $ 2,861 $ 3,030 $ 1,828 $ 1,903
Property and equipment, net ...................... 8,905 8,692 8,506 8,402 7,937
Total assets ................................... 14,094 14,849 14,465 12,588 11,796
Long-term debt (including current portion) .......... 2,141 1,894 1,894 1,893 1,892
Capital lease and financing obligations (including
current portion) .............................. 2,103 2,104 2,046 1,914 1,864
Shareholders’ equity ............................ 6,508 7,850 7,595 6,499 5,890
(a) Comparable store sales growth is based on sales for stores (including relocated or remodeled stores) which
were open throughout both the full current and prior year periods and E-Commerce.
(b) Net sales per selling square foot is based on stores open for the full current period, excluding E-Commerce.
(c) Average shareholders’ equity is based on a 5-quarter average for 2011 and 2010, and the two most recent
year-end balances for 2009, 2008, and 2007.
18