Kohl's 2011 Annual Report Download - page 11
Download and view the complete annual report
Please find page 11 of the 2011 Kohl's annual report below. You can navigate through the pages in the report by either clicking on the pages listed below, or by using the keyword search tool below to find specific information within the annual report.-
 1
1 -
 2
2 -
 3
3 -
 4
4 -
 5
5 -
 6
6 -
 7
7 -
 8
8 -
 9
9 -
 10
10 -
 11
11 -
 12
12 -
 13
13 -
 14
14 -
 15
15 -
 16
16 -
 17
17 -
 18
18 -
 19
19 -
 20
20 -
 21
21 -
 22
22 -
23
-
24
-
25
-
26
-
27
-
28
-
29
-
30
-
31
-
32
-
33
-
34
-
35
-
36
-
37
-
38
-
39
-
40
-
41
-
42
-
43
-
44
-
45
-
46
-
47
-
48
-
49
-
50
-
51
-
52
-
53
-
54
-
55
-
56
-
57
-
58
-
59
-
60
-
61
-
62
-
63
-
64
-
65
-
66
-
67
-
68
-
69
-
70
-
71
-
72
-
73
-
74
-
75
-
76
-
77
-
78
-
79
-
80
 |
 |

Our typical lease has an initial term of 20-25 years and four to eight renewal options for consecutive five-
year extension terms. Substantially all of our leases provide for a minimum annual rent that is fixed or adjusts to
set levels during the lease term, including renewals. Approximately one-fourth of the leases provide for
additional rent based on a percentage of sales over designated levels.
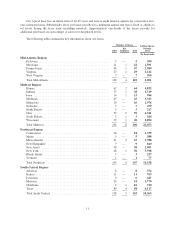
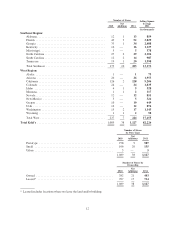
The following tables summarize key information about our stores.
Number of Stores Selling Square
Footage
20112010
Net
Additions 2011
(In thousands)
Mid-Atlantic Region:
Delaware ................................................ 5 — 5 399
Maryland ................................................ 21 1 22 1,591
Pennsylvania ............................................. 46 1 47 3,389
Virginia ................................................. 27 2 29 2,122
West Virginia ............................................ 7 — 7 500
Total Mid-Atlantic ......................................... 106 4 110 8,001
Midwest Region:
Illinois .................................................. 62 2 64 4,832
Indiana .................................................. 37 1 38 2,749
Iowa .................................................... 14 1 15 996
Michigan ................................................ 45 — 45 3,347
Minnesota ............................................... 26 — 26 1,976
Nebraska ................................................ 7 — 7 479
North Dakota ............................................. 3 — 3 217
Ohio .................................................... 57 2 59 4,341
South Dakota ............................................. 2 1 3 244
Wisconsin ............................................... 39 1 40 2,894
Total Midwest ............................................ 292 8 300 22,075
Northeast Region:
Connecticut .............................................. 18 — 18 1,339
Maine ................................................... 5 — 5 388
Massachusetts ............................................ 21 2 23 1,788
New Hampshire ........................................... 9 — 9 640
New Jersey .............................................. 38 — 38 2,901
New York ............................................... 48 2 50 3,798
Rhode Island ............................................. 3 — 3 227
Vermont ................................................. 1 — 177
Total Northeast ........................................... 143 4 147 11,158
South Central Region:
Arkansas ................................................ 8 — 8 572
Kansas .................................................. 11 — 11 765
Louisiana ................................................ 6 — 6 421
Missouri ................................................. 24 — 24 1,770
Oklahoma ............................................... 9 1 10 720
Texas ................................................... 80 4 84 6,117
Total South Central ........................................ 138 5 143 10,365
11