Kohl's 2011 Annual Report Download - page 25
Download and view the complete annual report
Please find page 25 of the 2011 Kohl's annual report below. You can navigate through the pages in the report by either clicking on the pages listed below, or by using the keyword search tool below to find specific information within the annual report.-
 1
1 -
2
-
3
-
4
-
5
-
6
-
7
-
8
-
9
-
10
-
11
-
12
-
13
-
14
-
 15
15 -
 16
16 -
 17
17 -
 18
18 -
 19
19 -
 20
20 -
 21
21 -
 22
22 -
 23
23 -
 24
24 -
 25
25 -
 26
26 -
 27
27 -
 28
28 -
 29
29 -
 30
30 -
 31
31 -
 32
32 -
 33
33 -
 34
34 -
 35
35 -
36
-
37
-
38
-
39
-
40
-
41
-
42
-
43
-
44
-
45
-
46
-
47
-
48
-
49
-
50
-
51
-
52
-
53
-
54
-
55
-
56
-
57
-
58
-
59
-
60
-
61
-
62
-
63
-
64
-
65
-
66
-
67
-
68
-
69
-
70
-
71
-
72
-
73
-
74
-
75
-
76
-
77
-
78
-
79
-
80
 |
 |

Investing activities.
Net cash used in investing activities increased $45 million to $802 million in 2011, primarily due to an
increase in capital expenditures.
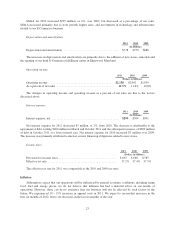
Capital expenditures totaled $927 million for 2011, a $126 million increase over 2010. This increase is
primarily due to higher capital spending for new stores, remodels, our third E-Commerce fulfillment center and a
call center in Texas.
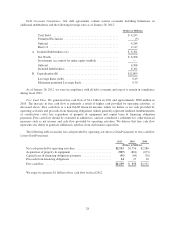
Capital expenditures by major category were as follows:
2012
Estimate 2011 2010 2009
New stores .............................................. 21% 27% 28% 55%
Remodels/relocations ...................................... 17 26 30 15
Distribution centers ....................................... 16 15 10 —
Computer hardware and software ............................ 24 18 17 11
Fixtures and store improvements ............................. 14 7 12 9
Other ................................................... 87310
Total ................................................... 100% 100% 100% 100%
We expect total capital expenditures of approximately $825 million in fiscal 2012. The decrease from 2011
is primarily due to a decrease in new store openings (approximately 20 expected in 2012 compared to 40 in 2011)
and a decrease in store remodels (approximately 50 expected in 2012 compared to 100 in 2011). We expect to
incur capital expenditures for construction of a fourth fulfillment center to support our E-Commerce business in
fiscal 2012. The spending on this project should be consistent with what was incurred in fiscal 2011 for the
construction of our third fulfillment center. The actual amount of our future capital expenditures will depend
primarily on the number and timing of new stores, distribution centers and E-Commerce fulfillment centers
opened; the mix of owned, leased or acquired stores; and the number of stores remodeled. We do not anticipate
that our expansion plans will be limited by any restrictive covenants in our financing agreements.
Sales of long-term investments generated cash of $145 million in 2011 and $42 million in 2010. As of
January 28, 2012, we had investments in auction rate securities (“ARS”) with a par value of $192 million and an
estimated fair value of $152 million. Since 2008, the market for ARS has diminished. This has limited our ability
to liquidate these investments, but we do not believe that it will have a significant impact on our ability to fund
ongoing operations and growth initiatives. To date, we have collected all interest payable on outstanding ARS
when due and expect to continue to do so in the future. Substantially all redemptions to date were made at par.
Net cash used in investing activities increased $108 million to $757 million in 2010, primarily due to an
increase in capital expenditures. Capital expenditures totaled $801 million for 2010, a $126 million increase over
2009. This increase is primarily due to higher capital spending as a result of increased remodels, the opening of
our second E-Commerce fulfillment center and planned incremental IT investments to support our E-Commerce
business. These increases were partially offset by reductions in capital spending for new stores.
Financing activities.
Our financing activities used cash of $2.4 billion in 2011 and $989 million in 2010. The increase is
primarily due to increased treasury stock purchases in 2011.
We repurchased 46 million shares of our common stock for approximately $2.3 billion in 2011. The shares
were purchased as part of our $3.5 billion share repurchase program. Pursuant to this program, we may
repurchase shares from time to time in open market transactions, accelerated stock repurchase programs, tender
offers, privately negotiated transactions or by other means. Subject to market conditions, we expect to complete
the program by the end of Fiscal 2013.
25