Kohl's 2011 Annual Report Download - page 20
Download and view the complete annual report
Please find page 20 of the 2011 Kohl's annual report below. You can navigate through the pages in the report by either clicking on the pages listed below, or by using the keyword search tool below to find specific information within the annual report.-
 1
1 -
2
-
3
-
4
-
5
-
6
-
7
-
8
-
9
-
 10
10 -
 11
11 -
 12
12 -
 13
13 -
 14
14 -
 15
15 -
 16
16 -
 17
17 -
 18
18 -
 19
19 -
 20
20 -
 21
21 -
 22
22 -
 23
23 -
 24
24 -
 25
25 -
 26
26 -
 27
27 -
 28
28 -
 29
29 -
 30
30 -
31
-
32
-
33
-
34
-
35
-
36
-
37
-
38
-
39
-
40
-
41
-
42
-
43
-
44
-
45
-
46
-
47
-
48
-
49
-
50
-
51
-
52
-
53
-
54
-
55
-
56
-
57
-
58
-
59
-
60
-
61
-
62
-
63
-
64
-
65
-
66
-
67
-
68
-
69
-
70
-
71
-
72
-
73
-
74
-
75
-
76
-
77
-
78
-
79
-
80
 |
 |

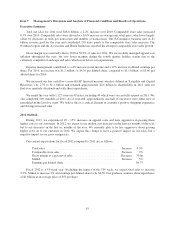
We expect to open approximately 20 new stores in 2012. Substantially all of the stores will be “small”
stores with less than 64,000 square feet of retail space. We are temporarily reducing the number of remodels to
approximately 50 stores in 2012 as we look at potential changes to our store layout to increase sales productivity
and operational efficiency.
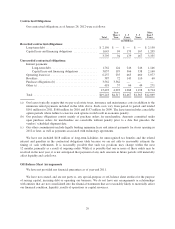
Results of Operations
Net sales.
2011 2010 2009
Net sales (In Millions) .................................... $18,804 $18,391 $17,178
Sales growth:
Total .............................................. 2.2% 7.1% 4.8%
Comparable stores (a) ................................. 0.5% 4.4% 0.4%
Net sales per selling square foot (b) .......................... $ 220 $ 222 $ 217
(a) Includes sales for stores (including relocated or remodeled stores) which were open throughout both the full
current and prior year periods and E-Commerce.
(b) Net sales per selling square foot is based on stores open for the full current period, excluding E-Commerce.
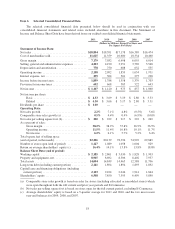
The changes in net sales were due to the following:
2011 2010 2009
(Dollars in Millions)
Comparable store sales: $% $%$%
Stores ............................... $(175) (1.0)% $ 500 3.1% $ (62) (0.4)%
E-Commerce (a) ....................... 267 37.2 244 51.7 132 38.7
Total ................................ 92 0.5 744 4.4 70 0.4
Sales from new stores and other revenues ....... 321 — 469 — 719 —
Increase in net sales ........................ $ 413 2.2% $1,213 7.1% $789 4.8%
(a) Excludes shipping and other revenues
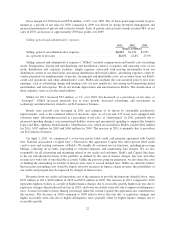
Drivers of the changes in comparable store sales were as follows:
2011 2010 2009
Selling price per unit ............................................... 6.6% (1.5)% 2.3%
Units per transaction ............................................... (4.9) (1.5) (4.3)
Average transaction value ........................................... 1.7 (3.0) (2.0)
Number of transactions ............................................. (1.2) 7.4 2.4
Comparable store sales .............................................. 0.5% 4.4% 0.4%
The increase in selling price per unit reflects higher sales prices as we were more aggressive in passing
higher apparel costs on to our customers. As a result of these price increases there was some resistance from our
customers in both units per transaction and number of transactions per store.
20