Kohl's 2011 Annual Report Download - page 22
Download and view the complete annual report
Please find page 22 of the 2011 Kohl's annual report below. You can navigate through the pages in the report by either clicking on the pages listed below, or by using the keyword search tool below to find specific information within the annual report.-
 1
1 -
2
-
3
-
4
-
5
-
6
-
7
-
8
-
9
-
10
-
11
-
 12
12 -
 13
13 -
 14
14 -
 15
15 -
 16
16 -
 17
17 -
 18
18 -
 19
19 -
 20
20 -
 21
21 -
 22
22 -
 23
23 -
 24
24 -
 25
25 -
 26
26 -
 27
27 -
 28
28 -
 29
29 -
 30
30 -
 31
31 -
 32
32 -
33
-
34
-
35
-
36
-
37
-
38
-
39
-
40
-
41
-
42
-
43
-
44
-
45
-
46
-
47
-
48
-
49
-
50
-
51
-
52
-
53
-
54
-
55
-
56
-
57
-
58
-
59
-
60
-
61
-
62
-
63
-
64
-
65
-
66
-
67
-
68
-
69
-
70
-
71
-
72
-
73
-
74
-
75
-
76
-
77
-
78
-
79
-
80
 |
 |

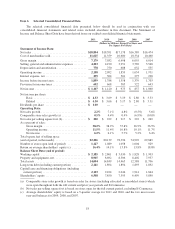
Gross margin for 2010 increased $534 million, or 8%, over 2009. The 41 basis point improvement in gross
margin as a percent of net sales for 2010 compared to 2009 was driven by strong inventory management and
increased penetration of private and exclusive brands. Sales of private and exclusive brands reached 48% of net
sales in 2010, an increase of approximately 290 basis points over 2009.
Selling, general and administrative expenses.
2011 2010 2009
(Dollars in Millions)
Selling, general, and administrative expenses ..................... $4,243 $4,190 $3,951
As a percent of net sales ...................................... 22.6% 22.8% 23.0%
Selling, general and administrative expenses (“SG&A”) include compensation and benefit costs (including
stores, headquarters, buying and merchandising and distribution centers); occupancy and operating costs of our
retail, distribution and corporate facilities; freight expenses associated with moving merchandise from our
distribution centers to our retail stores and among distribution and retail facilities; advertising expenses, offset by
vendor payments for reimbursement of specific, incremental and identifiable costs; net revenues from our Kohl’s
credit card operations; and other administrative costs. SG&A also includes the costs incurred prior to new store
openings, such as advertising, hiring and training costs for new employees, processing and transporting initial
merchandise, and rent expense. We do not include depreciation and amortization in SG&A. The classification of
these expenses varies across the retail industry.
SG&A for 2011 increased $53 million, or 1%, over 2010, but decreased as a percentage of net sales, or
“leveraged.” SG&A increased primarily due to store growth, increased advertising, and investments in
technology and infrastructure related to our E-Commerce business.
Hourly store payroll costs leveraged in 2011 and continues to be driven by sustainable productivity
improvements, such as the continued rollout of electronic signs. As of year-end, 475 stores were equipped with
electronic signs. Advertising increased as a percentage of net sales, or “deleveraged,” in 2011, primarily due to
increased spending during a very promotional holiday season and incremental spending to support the Jennifer
Lopez and Marc Anthony brand launches. Distribution costs, which are included in SG&A, totaled $202 million
for 2011, $187 million for 2010 and $168 million for 2009. The increase in 2011 is primarily due to growth in
our E-Commerce business.
On April 1, 2011, we commenced a seven-year private label credit card program agreement with Capital
One, National Association (“Capital One”). Pursuant to this agreement, Capital One offers private label credit
cards to new and existing customers of Kohl’s. We handle all customer service functions, including processing
billings, collecting on accounts, responding to customer inquiries, and maintaining data systems. We are also
responsible for all advertising and marketing related to our credit card customers. Kohl’s and Capital One share
in the net risk-adjusted revenue of the portfolio as defined by the sum of finance charges, late fees and other
revenue less write-offs of uncollectible accounts. Unlike the previous program agreement, we also share the costs
of funding the outstanding receivables if interest rates were to exceed defined rates. While we currently believe
that increases in funding costs would be largely offset by increases in finance charge revenue, the profitability of
our credit card program may be impacted by changes in interest rates.
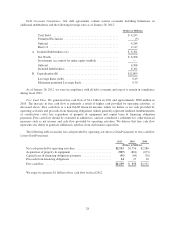
Revenues from our credit card operations, net of the expenses to provide the functions detailed above, were
$347 million in 2011, $180 million in 2010 and $252 million in 2009. The increase in 2011 compared to 2010
represents higher revenues as a result of higher finance charges due to receivable growth, higher late fees due to
regulatory changes which reduced late fees in 2010, and lower receivable write-offs due to improved delinquency
rates. A more favorable revenue sharing percentage under the current Capital One agreement also contributed to
the increase. The decrease in 2010 compared to 2009 reflects lower late fees due to regulatory changes and
higher receivable write-offs due to higher delinquency rates, partially offset by higher finance charges due to
receivable growth.
22