Kohl's 2011 Annual Report Download - page 63
Download and view the complete annual report
Please find page 63 of the 2011 Kohl's annual report below. You can navigate through the pages in the report by either clicking on the pages listed below, or by using the keyword search tool below to find specific information within the annual report.-
 1
1 -
2
-
3
-
4
-
5
-
6
-
7
-
8
-
9
-
10
-
11
-
12
-
13
-
14
-
15
-
16
-
17
-
18
-
19
-
20
-
21
-
22
-
23
-
24
-
25
-
26
-
27
-
28
-
29
-
30
-
31
-
32
-
33
-
34
-
35
-
36
-
37
-
38
-
39
-
40
-
41
-
42
-
43
-
44
-
45
-
46
-
47
-
48
-
49
-
50
-
51
-
52
-
 53
53 -
 54
54 -
 55
55 -
 56
56 -
 57
57 -
 58
58 -
 59
59 -
 60
60 -
 61
61 -
 62
62 -
 63
63 -
 64
64 -
 65
65 -
 66
66 -
 67
67 -
 68
68 -
 69
69 -
 70
70 -
 71
71 -
 72
72 -
 73
73 -
74
-
75
-
76
-
77
-
78
-
79
-
80
 |
 |

KOHL’S CORPORATION
NOTES TO CONSOLIDATED FINANCIAL STATEMENTS—(Continued)
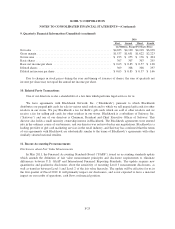
3. Fair Value Measurements (continued)
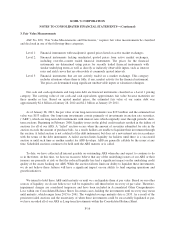
The fair value for our ARS is based on third-party pricing models and is classified as a Level 3 pricing
category. We utilized a discounted cash flow model to estimate the current fair market value for each of the
securities we owned as there was no recent activity in the secondary markets in these types of securities. This
model used unique inputs for each security including discount rate, interest rate currently being paid and
maturity. The discount rate was calculated using the closest match available for other insured asset backed
securities. A market failure scenario was employed as recent successful auctions of these securities were very
limited.
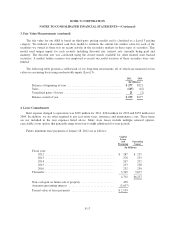
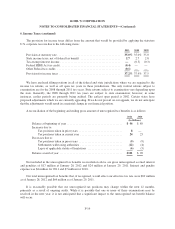
The following table presents a rollforward of our long-term investments, all of which are measured at fair
value on a recurring basis using unobservable inputs (Level 3):
2011 2010
(In Millions)
Balance at beginning of year ..................................... $ 277 $321
Sales ........................................................ (145) (42)
Unrealized gains / (losses) ....................................... 21 (2)
Balance at end of year .......................................... $ 153 $277
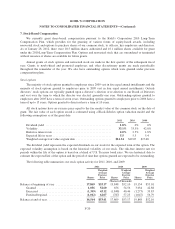
4.Lease Commitments
Rent expense charged to operations was $265 million for 2011, $264 million for 2010 and $253 million for
2009. In addition, we are often required to pay real estate taxes, insurance and maintenance costs. These items
are not included in the rent expenses listed above. Many store leases include multiple renewal options,
exercisable at our option, that generally range from four to eight additional five-year periods.
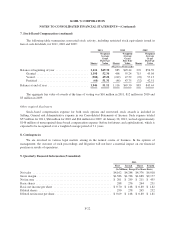
Future minimum lease payments at January 28, 2012 are as follows:
Capital
Lease
and
Financing
Operating
Leases
(In Millions)
Fiscal year:
2012 ............................................... $ 287 $ 235
2013 ............................................... 278 233
2014 ............................................... 267 232
2015 ............................................... 253 230
2016 ............................................... 252 230
Thereafter ............................................... 3,365 5,077
4,702 $6,237
Non-cash gain on future sale of property ...................... 458
Amount representing interest ............................... (3,057)
Present value of lease payments ............................. $2,103
F-17