Kohl's 2011 Annual Report Download - page 21
Download and view the complete annual report
Please find page 21 of the 2011 Kohl's annual report below. You can navigate through the pages in the report by either clicking on the pages listed below, or by using the keyword search tool below to find specific information within the annual report.-
 1
1 -
2
-
3
-
4
-
5
-
6
-
7
-
8
-
9
-
10
-
 11
11 -
 12
12 -
 13
13 -
 14
14 -
 15
15 -
 16
16 -
 17
17 -
 18
18 -
 19
19 -
 20
20 -
 21
21 -
 22
22 -
 23
23 -
 24
24 -
 25
25 -
 26
26 -
 27
27 -
 28
28 -
 29
29 -
 30
30 -
 31
31 -
32
-
33
-
34
-
35
-
36
-
37
-
38
-
39
-
40
-
41
-
42
-
43
-
44
-
45
-
46
-
47
-
48
-
49
-
50
-
51
-
52
-
53
-
54
-
55
-
56
-
57
-
58
-
59
-
60
-
61
-
62
-
63
-
64
-
65
-
66
-
67
-
68
-
69
-
70
-
71
-
72
-
73
-
74
-
75
-
76
-
77
-
78
-
79
-
80
 |
 |

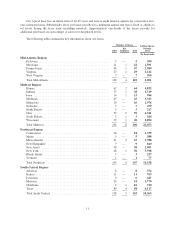
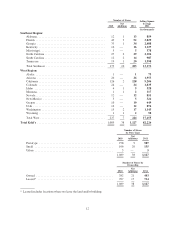
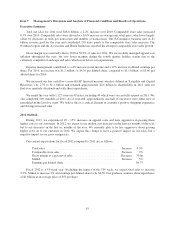
The Northeast region reported the strongest 2011 sales growth with comparable store sales increases in the
low-single digits. All other regions reported comparable store sales decreases of one to three percent for the year.
E-Commerce revenue, which includes shipping and other revenues, reached $1 billion in 2011. This
represents a $269 million increase over 2010 E-commerce revenue of $743 million. The number of E-Commerce
transactions increased almost 42% due to increased customer traffic, increased style and size selections offered
on-line compared with our in-store selection and the expansion of product categories not available in our stores.
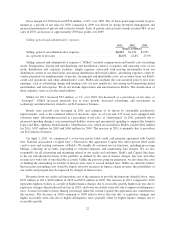
By line of business, Accessories and Home provided the strongest comparable store sales growth for the
year. Accessories was led by strength in watches and Home was led by electrics. Children’s and Men’s both
outperformed the Company average. Men’s saw growth in dress shirts and basics and Children’s was led by toys.
Women’s had positive comparable store growth on strength in active and updated sportswear. Footwear recorded
a low single-digit comparable store decrease for the year. Women’s shoes performed well with low double-digit
comparable store sales growth, however, athletic shoes reported a low double-digit comparable store sales
decline.
Net sales per selling square foot, which is based on stores open for the full current period, excluding
E-Commerce, decreased $2 to $220 in 2011. The decrease is primarily due to a one percent decrease in sales at
our comparable stores.
Net sales for 2010 increased 7.1% over 2009 and comparable store sales increased 4.4%. From a line of
business perspective, Footwear reported the strongest comparable store sales in 2010 with strength in women’s
and juniors’ shoes. Men’s and Home outperformed the Company average for the year, while Accessories and
Children’s trailed the Company average. Women’s was similar to the Company average. The Southeast region
reported the strongest comparable store sales for 2010. In 2010, the Southeast region benefited from
implementing merchandising and marketing tactics similar to those that were implemented in the West region in
2009. E-Commerce revenue, which includes shipping and other revenues, increased $252 million to $743 million
for 2010.
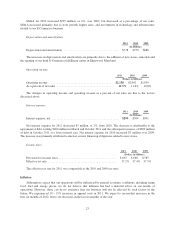
Gross margin.
2011 2010 2009
(Dollars in Millions)
Gross margin .............................................. $7,179 $7,032 $6,498
As a percent of net sales ...................................... 38.2% 38.2% 37.8%
Gross margin includes the total cost of products sold, including product development costs, net of vendor
payments other than reimbursement of specific, incremental and identifiable costs; inventory shrink; markdowns;
freight expenses associated with moving merchandise from our vendors to our distribution centers; shipping and
handling expenses of E-Commerce sales; and terms cash discount. Our gross margin may not be comparable with
that of other retailers because we include distribution center costs in selling, general and administrative expenses
while other retailers may include these expenses in cost of merchandise sold.
Gross margin increased $147 million, or 2%, in 2011 compared to 2010. Gross margin as a percentage of
sales decreased 6 basis points to 38.2 % for 2011. Inventory management, increased penetration of private and
exclusive brands (which have a higher gross margin rate than national brands) and ongoing markdown and size
optimization initiatives all had a favorable impact on our gross margin rate. During 2011, we successfully
managed apparel cost inflation throughout the year, but saw lower gross margin during the fourth quarter holiday
season due to the extremely competitive landscape and sales which were below our expectations. Our
E-Commerce business decreased our gross margin rate by approximately 70 basis points. This business currently
has a lower gross margin than our stores due to the mix of products sold on-line and free or reduced cost shipping
promotions.
21