Kohl's 2011 Annual Report Download - page 24
Download and view the complete annual report
Please find page 24 of the 2011 Kohl's annual report below. You can navigate through the pages in the report by either clicking on the pages listed below, or by using the keyword search tool below to find specific information within the annual report.-
 1
1 -
2
-
3
-
4
-
5
-
6
-
7
-
8
-
9
-
10
-
11
-
12
-
13
-
 14
14 -
 15
15 -
 16
16 -
 17
17 -
 18
18 -
 19
19 -
 20
20 -
 21
21 -
 22
22 -
 23
23 -
 24
24 -
 25
25 -
 26
26 -
 27
27 -
 28
28 -
 29
29 -
 30
30 -
 31
31 -
 32
32 -
 33
33 -
 34
34 -
35
-
36
-
37
-
38
-
39
-
40
-
41
-
42
-
43
-
44
-
45
-
46
-
47
-
48
-
49
-
50
-
51
-
52
-
53
-
54
-
55
-
56
-
57
-
58
-
59
-
60
-
61
-
62
-
63
-
64
-
65
-
66
-
67
-
68
-
69
-
70
-
71
-
72
-
73
-
74
-
75
-
76
-
77
-
78
-
79
-
80
 |
 |

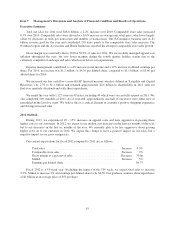
Liquidity and Capital Resources
Our primary ongoing cash requirements are for capital expenditures in connection with our expansion and
remodeling programs and seasonal and new store inventory purchases. Share repurchases and dividend payments
to shareholders are currently another significant usage of cash. These payments are discretionary and can be
discontinued at any time should we require cash for other uses. Our primary sources of funds are cash flow
provided by operations, short-term trade credit and our lines of credit. Short-term trade credit, in the form of
extended payment terms for inventory purchases, often represents a significant source of financing for
merchandise inventories. Seasonal cash needs may be met by cash on hand and/or the line of credit available
under our revolving credit facility. Our working capital and inventory levels typically build throughout the fall,
peaking during the November and December holiday selling season.
As of January 28, 2012, we had cash and cash equivalents of $1.2 billion. We generated $1.1 billion of free
cash flow in 2011. (See the Free Cash Flow discussion later in this Liquidity and Capital Resources section for
additional discussion of this non-GAAP financial measure.)
2011 2010 2009
(Dollars in Millions)
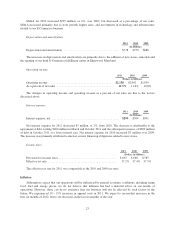
Net cash provided by (used in):
Operating activities ......................................... $ 2,143 $1,756 $2,286
Investing activities ......................................... (802) (757) (649)
Financing activities ......................................... (2,413) (989) (13)
Operating activities.
Cash provided by operations increased 22% in 2011 to $2.1 billion.
Total merchandise inventories at January 28, 2012 were $163 million, or 5%, higher than year-end 2010. On
a per store basis, merchandise inventories at January 28, 2012 increased 2% in dollars over year-end 2010, but
decreased 7% in units. The decrease in units per store reflects our various inventory management initiatives,
including our conservative sales and receipt planning and lower clearance levels. The increase in dollars per store
reflects higher merchandise costs over 2010.
Accounts payable at January 28, 2012 increased $95 million over year-end 2010. The increase is primarily
due to expiration of vendor financing initiatives. Timing of inventory purchases also contributed to the change.
Accounts payable as a percent of inventory was 38.5% at January 28, 2012, compared to 37.5% at year-end
2010. The increase is primarily due to higher accounts payable balances with some vendors over year-end 2010,
due to timing of when these vendors required payment.
Cash provided by operations decreased $530 million from $2.3 billion in 2009 to $1.8 billion in 2010. The
decrease was primarily due to a $356 million decrease in cash flows from accounts payable activities. Accounts
payable at January 29, 2011 decreased $50 million from year-end 2009. Accounts payable as a percent of
inventory was 37.5% at January 29, 2011, compared to 40.6% at year-end 2009. The change is primarily due to
vendor finance initiatives which were fully implemented at year-end 2010. In prior years, we rolled out a
receivable financing program whereby a financial institution provides our vendors with financing, at a rate which
is below what the vendors could normally obtain on their own. We offer this program to vendors in exchange for
extended payment terms. We do not incur any costs or expenses or forfeit any portion of our receivables in
connection with this program. Timing of inventory purchases also contributed to the change.
24