Kohl's 2011 Annual Report Download - page 13
Download and view the complete annual report
Please find page 13 of the 2011 Kohl's annual report below. You can navigate through the pages in the report by either clicking on the pages listed below, or by using the keyword search tool below to find specific information within the annual report.-
 1
1 -
2
-
 3
3 -
 4
4 -
 5
5 -
 6
6 -
 7
7 -
 8
8 -
 9
9 -
 10
10 -
 11
11 -
 12
12 -
 13
13 -
 14
14 -
 15
15 -
 16
16 -
 17
17 -
 18
18 -
 19
19 -
 20
20 -
 21
21 -
 22
22 -
 23
23 -
24
-
25
-
26
-
27
-
28
-
29
-
30
-
31
-
32
-
33
-
34
-
35
-
36
-
37
-
38
-
39
-
40
-
41
-
42
-
43
-
44
-
45
-
46
-
47
-
48
-
49
-
50
-
51
-
52
-
53
-
54
-
55
-
56
-
57
-
58
-
59
-
60
-
61
-
62
-
63
-
64
-
65
-
66
-
67
-
68
-
69
-
70
-
71
-
72
-
73
-
74
-
75
-
76
-
77
-
78
-
79
-
80
 |
 |

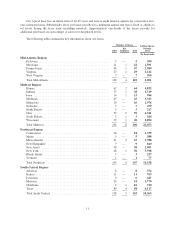
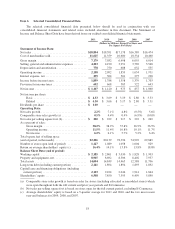
Number of Stores
by Location
2010
Net
Additions 2011
Strip centers ................................................ 751 13 764
Community & regional malls .................................. 78 5 83
Free standing ............................................... 260 20 280
1,089 38 1,127
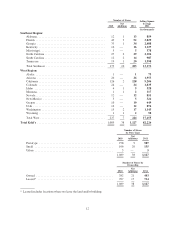
Number of Stores
by Building Type
2010
Net
Additions 2011
One-story .................................................. 1,000 35 1,035
Multi-story ................................................. 89 3 92
1,089 38 1,127
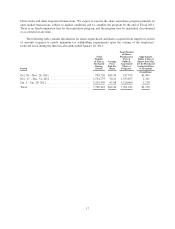
Distribution Centers
The following table summarizes key information about each of our distribution centers.
Location
Year
Opened
Square
Footage States Serviced
Approximate
Store
Capacity
Retail:
Findlay, Ohio ................ 1994 780,000 Ohio, Michigan, Indiana 130
Winchester, Virginia .......... 1997 420,000 Pennsylvania, Virginia, Maryland,
Delaware, West Virginia
120
Blue Springs, Missouri ........ 1999 540,000 Minnesota, Colorado, Missouri,
Iowa, Kansas, Montana, Nebraska,
North Dakota, South Dakota,
Wyoming
110
Corsicana, Texas ............. 2001 540,000 Texas, Oklahoma, Arkansas,
Mississippi, Louisiana
115
Mamakating, New York ....... 2002 605,000 New York, New Jersey,
Massachusetts, Connecticut, New
Hampshire, Rhode Island, Maine,
Vermont
145
San Bernardino, California ..... 2002 575,000 California, Arizona, Nevada, Utah,
New Mexico
110
Macon, Georgia .............. 2005 560,000 Alabama, Tennessee, Georgia,
South Carolina, Florida, Kentucky,
North Carolina
155
Patterson, California .......... 2006 360,000 Alaska, California, Oregon,
Washington, Idaho
100
Ottawa, Illinois .............. 2008 328,000 Indiana, Illinois, Michigan,
Wisconsin
165
E-Commerce:
Monroe, Ohio ................ 2001 940,000 — —
San Bernardino, California ..... 2010 970,000 — —
Edgewood, Maryland .......... 2011 1,000,000 — —
We own all of the distribution centers except Corsicana, Texas, which is leased.
13