Kia 2003 Annual Report Download - page 8
Download and view the complete annual report
Please find page 8 of the 2003 Kia annual report below. You can navigate through the pages in the report by either clicking on the pages listed below, or by using the keyword search tool below to find specific information within the annual report.
08 Kia Motors Corporation
President’s M essage
2003
(Korean won in millions)
Current assets
Non-current assets
Total assets
Current liabilities
Long-term liabilities
Total liabilities
Capital stock
Capital surplus
Retained earnings
Capital adjustments
Total shareholders’ equity
Total liabilities and shareholders’ equity
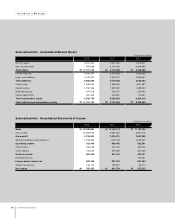
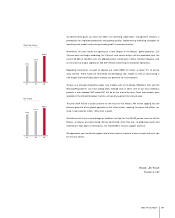
Summarized Non-Consolidated Balance Sheets
3,251,294
7,959,838
11,211,132
3,839,030
2,029,923
5,868,953
1,848,652
1,700,956
841,078
951,493
5,342,179
11,211,132
₩
₩
2002
2,921,333
6,191,315
9,112,648
2,679,543
2,339,421
5,018,964
1,848,652
1,699,924
316,427
228,681
4,093,684
9,112,648
₩
₩
2001
2,419,877
6,018,589
8,438,466
2,540,899
2,504,551
5,045,450
1,847,987
1,699,924
-324,952
170,057
3,393,016
8,438,466
₩
₩
2003
(Korean won in millions)
Sales
Cost of sales
Gross profit
Selling and administrative expenses
Operating income
Other income
Other expense
Ordinary income
Extraordinary item
Income before income tax
Income tax expense
Net income
Summarized Non-Consolidated Statements of Income
12,839,881
10,084,078
2,755,803
1,943,363
812,440
456,205
415,046
853,599
-
853,599
148,176
705,423
₩
₩
2002
12,158,113
9,581,392
2,576,721
1,918,228
658,493
542,725
399,908
801,310
-
801,310
159,931
641,379
₩
₩
2001
11,129,204
8,531,616
2,597,588
2,075,347
522,241
404,375
502,465
424,151
197,301
621,452
69,217
552,235
₩
₩

