Kia 2003 Annual Report Download - page 63
Download and view the complete annual report
Please find page 63 of the 2003 Kia annual report below. You can navigate through the pages in the report by either clicking on the pages listed below, or by using the keyword search tool below to find specific information within the annual report.-
 1
1 -
2
-
3
-
4
-
5
-
6
-
7
-
8
-
9
-
10
-
11
-
12
-
13
-
14
-
15
-
16
-
17
-
18
-
19
-
20
-
21
-
22
-
23
-
24
-
25
-
26
-
27
-
28
-
29
-
30
-
31
-
32
-
33
-
34
-
35
-
36
-
37
-
38
-
39
-
40
-
41
-
42
-
43
-
44
-
45
-
46
-
47
-
48
-
49
-
50
-
51
-
52
-
 53
53 -
 54
54 -
 55
55 -
 56
56 -
 57
57 -
 58
58 -
 59
59 -
 60
60 -
 61
61 -
 62
62 -
 63
63 -
 64
64 -
 65
65 -
 66
66 -
 67
67 -
 68
68 -
 69
69 -
 70
70 -
 71
71 -
 72
72 -
 73
73 -
74
-
75
-
76
-
77
-
78
-
79
-
80
-
81
-
82
-
83
-
84
-
85
-
86
-
87
-
88
-
89
-
90
 |
 |
2003 Annual Report 63
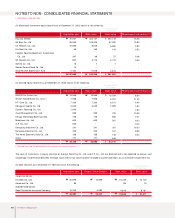
for as a charge to beginning retained earnings for ₩120,904 million (US$100,938 thousand) up to prior year, gain on valuation of ₩53,250
million (US$44,457 thousand) reflected in current operations and gain on valuation of equity securities accounted for using the equity method
of ₩27,905 million (US$23,296 thousand) reflected in capital adjustments.
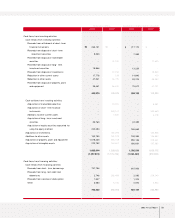
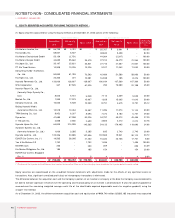
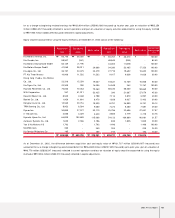
Equity securities accounted for using the equity method as of December 31, 2002 consist of the following :
As of December 31, 2002, the difference between acquisition cost and equity value of ₩131,707 million (US$109,957 thousand) was
accounted for as a charge to beginning accumulated deficit for ₩164,680 million (US$137,485 thousand) up to prior year, gain on valuation of
₩43,776 million (US$36,547 thousand) reflected in current operations and loss on valuation of equity securities accounted for using the equity
method of ₩10,803 million (US$9,019 thousand) reflected in capital adjustments.
Acquisition
cost
Korean won (in millions) U.S. dollars (Note 2) (in thousands)
Kia Motors America, Inc.
Kia Canada, Inc.
Kia Motors Deutschland GmbH
Kia Motors Europe GmbH
Kia Japan Co., Ltd.
PT. Kia Timor Motors
Dong feng Yueda-Kia Motors
Co., Ltd.
Kia Tigers Co., Ltd.
Hyundai Powertech Co., Ltd.
WIA Corporation
Haevichi Resort Co., Ltd.
Bontek Co., Ltd.
Donghui Auto Co., Ltd.
TRW Steering Co., Ltd.
Dymos Inc.
e-HD.com Inc.
Hyundai Hysco Co., Ltd.
Autoever Systems Co., Ltd.
Yan Ji Kia Motors A/S
NGVTEK Com
Kia Service Philippines Co.
66,798
58,507
53,139
41,060
33,197
10,908
22,316
20,300
70,000
347
8,520
1,950
10,530
8,952
30,850
4,558
64,829
1,000
1,792
250
185
509,988
₩
₩
Net equity
value
36,305
(341)
(1,779)
38,911
23,479
11,532
15,259
290
70,263
61,911
3,438
11,891
29,716
6,564
27,077
3,329
192,689
2,186
-
-
-
532,720
₩
₩
Book value
-
-
-
20,666
23,479
11,532
19,007
14,094
70,263
32,425
4,788
6,470
10,530
9,080
33,119
3,329
115,086
2,186
1,792
250
185
378,281
₩
₩
Acquisition
cost
55,767
48,845
44,364
34,280
27,715
9,107
18,631
16,948
58,440
290
7,113
1,628
8,791
7,474
25,756
3,805
54,123
835
1,496
209
154
425,771
$
$
Net equity
value
30,310
(285)
(1,485)
32,485
19,602
9,628
12,739
242
58,660
51,687
2,870
9,927
24,809
5,480
22,606
2,779
160,869
1,825
-
-
-
444,748
$
$
Book value
-
-
-
17,253
19,602
9,628
15,868
11,767
58,660
27,070
3,997
5,402
8,791
7,581
27,651
2,779
96,081
1,825
1,496
209
154
315,814
$
$
Ownership
percentage
(% )
100.00
82.53
100.00
100.00
100.00
30.00
50.00
100.00
50.00
45.30
40.00
39.00
35.12
29.00
27.07
22.76
21.57
20.00
100.00
24.39
20.00