Kia 2003 Annual Report Download - page 65
Download and view the complete annual report
Please find page 65 of the 2003 Kia annual report below. You can navigate through the pages in the report by either clicking on the pages listed below, or by using the keyword search tool below to find specific information within the annual report.-
 1
1 -
2
-
3
-
4
-
5
-
6
-
7
-
8
-
9
-
10
-
11
-
12
-
13
-
14
-
15
-
16
-
17
-
18
-
19
-
20
-
21
-
22
-
23
-
24
-
25
-
26
-
27
-
28
-
29
-
30
-
31
-
32
-
33
-
34
-
35
-
36
-
37
-
38
-
39
-
40
-
41
-
42
-
43
-
44
-
45
-
46
-
47
-
48
-
49
-
50
-
51
-
52
-
53
-
54
-
 55
55 -
 56
56 -
 57
57 -
 58
58 -
 59
59 -
 60
60 -
 61
61 -
 62
62 -
 63
63 -
 64
64 -
 65
65 -
 66
66 -
 67
67 -
 68
68 -
 69
69 -
 70
70 -
 71
71 -
 72
72 -
 73
73 -
 74
74 -
 75
75 -
76
-
77
-
78
-
79
-
80
-
81
-
82
-
83
-
84
-
85
-
86
-
87
-
88
-
89
-
90
 |
 |
2003 Annual Report 65
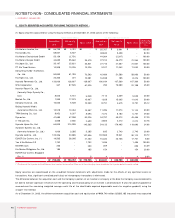
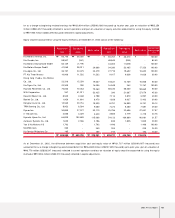
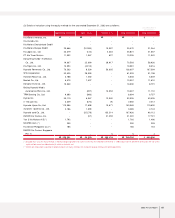
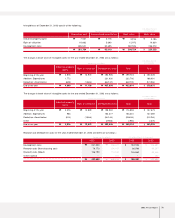
(3) Details of valuation using the equity method for the year ended December 31, 2003 are as follows :
Beginning of period
Korean won (in millions)
U.S. dollars (Note 2)
(in thousands)
Kia Motors America, Inc.
Kia Canada, Inc.
Kia Motors Deutschland GmbH
Kia Motors Europe GmbH
Kia Japan Co., Ltd.
PT. Kia Timor Motors
Dong feng Yueda-Kia Motors
Co., Ltd.
Kia Tigers Co., Ltd.
Hyundai Powertech Co., Ltd.
WIA Corporation
Haevichi Resort Co., Ltd.
Bontek Co., Ltd.
Donghui Auto Co., Ltd.
Beijing Hyundai Mobis
Automotive Parts Co., Ltd.
TRW Steering Co., Ltd.
Dymos Inc.
e-HD.com Inc.
Hyundai Hysco Co., Ltd.
Autoever Systems Co., Ltd.
Hyundai card Co., Ltd.
EUKOR Car Carriers, Inc.
Yan Ji Kia Motors A/S (* )
NGVTEK Com (* )
Kia Service Philippines Co.(* )
EUKOR Car Carriers Singapore
Pte. (* )
-
-
-
20,666
23,479
11,532
19,007
14,094
70,263
32,425
4,788
6,470
10,530
-
9,080
33,119
3,329
115,086
2,186
-
-
1,792
250
185
-
378,281
₩
₩
Gain / Loss
-
-
-
(10,283)
(122)
1,067
22,669
(4,013)
8,339
28,900
1,260
7,437
-
(287)
(986)
6,567
(670)
17,608
1,099
(25,278)
(57)
-
-
-
-
53,250
₩
₩
Others (* * )
-
-
-
15,087
2,464
627
28,917
-
50,005
-
-
-
-
13,594
-
12,340
(9)
10,671
-
133,214
21,259
-
-
-
5
288,174
₩
₩
End of period
-
-
-
25,470
25,821
13,226
70,593
10,081
128,607
61,325
6,048
13,907
10,530
13,307
8,094
52,026
2,650
143,365
3,285
107,936
21,202
1,792
250
185
5
719,705
₩
₩
End of period
-
-
-
21,264
21,557
11,042
58,936
8,416
107,369
51,198
5,049
11,610
8,791
11,110
6,757
43,436
2,212
119,690
2,743
90,112
17,701
1,496
209
154
4
600,856
$
$
(* ) Excluded from using the equity method as individual beginning balance of assets are less than the required assets level of £7,000 million and the differences arising from the use of the
equity method are not considered material, which are stated at cost.
(* * ) Others are composed of acquisition or disposal amounts of equity securities, the changes in retained earnings and capital adjustments.