Kia 2003 Annual Report Download - page 49
Download and view the complete annual report
Please find page 49 of the 2003 Kia annual report below. You can navigate through the pages in the report by either clicking on the pages listed below, or by using the keyword search tool below to find specific information within the annual report.-
 1
1 -
2
-
3
-
4
-
5
-
6
-
7
-
8
-
9
-
10
-
11
-
12
-
13
-
14
-
15
-
16
-
17
-
18
-
19
-
20
-
21
-
22
-
23
-
24
-
25
-
26
-
27
-
28
-
29
-
30
-
31
-
32
-
33
-
34
-
35
-
36
-
37
-
38
-
 39
39 -
 40
40 -
 41
41 -
 42
42 -
 43
43 -
 44
44 -
 45
45 -
 46
46 -
 47
47 -
 48
48 -
 49
49 -
 50
50 -
 51
51 -
 52
52 -
 53
53 -
 54
54 -
 55
55 -
 56
56 -
 57
57 -
 58
58 -
 59
59 -
60
-
61
-
62
-
63
-
64
-
65
-
66
-
67
-
68
-
69
-
70
-
71
-
72
-
73
-
74
-
75
-
76
-
77
-
78
-
79
-
80
-
81
-
82
-
83
-
84
-
85
-
86
-
87
-
88
-
89
-
90
 |
 |
2003 Annual Report 49
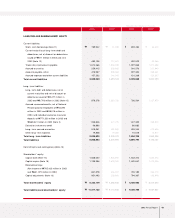
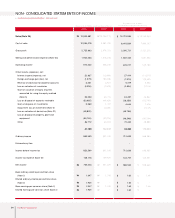
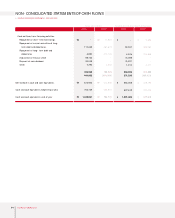
Korean won (in millions) Translation into U.S.dollars (in thousands)
LIABILITIES AND SHAREHOLDERSEQUITY
Current liabilities:
Short-term borrowings (Note 11)
Current maturities of long-term debt and
debentures, net of discount on debentures
issued of ₩571 million in 2003 and nil in
2002 (Note 12)
Trade notes and accounts payable
Accrued warranties
Accounts payable-other
Accrued expenses and other current liabilities
Total current liabilities
Long-term liabilities:
Long-term debt and debentures, net of
current maturities and net of discount on
debentures issued of ₩3,477 million in
2003 and ₩8,700 million in 2002 (Note 12)
Accrued severance benefits, net of National
Pension paid for employees of ₩44,892
million in 2003 and ₩48,018 million in
2002, and individual severance insurance
deposits of ₩771,330 million in 2003 and
₩668,441 million in 2002 (Note 2)
Derivative instruments credit
Long-term accrued warranties
Other long-term liabilities
Total long-term liabilities
Total liabilities
Commitments and contingencies (Note 13)
Shareholdersequity:
Capital stock (Note 14)
Capital surplus (Note 15)
Retained earnings
(Net income of ₩705,423 million in 2003
and ₩641,379 million in 2002)
Capital adjustments (Note 16)
Total shareholdersequity
Total liabilities and shareholdersequity
789,942
482,138
1,674,366
259,415
475,937
157,232
3,839,030
870,278
523,846
96,880
519,061
19,858
2,029,923
5,868,953
-
1,848,652
1,700,956
841,078
951,493
5,342,179
11,211,132
41,299
112,551
1,578,099
253,865
549,384
144,345
2,679,543
1,350,726
477,770
-
491,860
19,065
2,339,421
5,018,964
-
1,848,652
1,699,924
316,427
228,681
4,093,684
9,112,648
659,494
402,519
1,397,868
216,576
397,343
131,268
3,205,068
726,564
437,340
80,882
433,345
16,578
1,694,709
4,899,777
-
1,543,373
1,420,067
702,185
794,367
4,459,992
9,359,769
34,479
93,965
1,317,498
211,943
458,661
120,507
2,237,053
1,127,673
398,872
-
410,636
15,917
1,953,098
4,190,151
-
1,543,373
1,419,205
264,174
190,918
3,417,670
7,607,821
2003 2002 2003 2002
₩
₩
₩
₩
₩
₩
$
$
$
$
$
$