Kia 2003 Annual Report Download - page 42
Download and view the complete annual report
Please find page 42 of the 2003 Kia annual report below. You can navigate through the pages in the report by either clicking on the pages listed below, or by using the keyword search tool below to find specific information within the annual report.-
 1
1 -
2
-
3
-
4
-
5
-
6
-
7
-
8
-
9
-
10
-
11
-
12
-
13
-
14
-
15
-
16
-
17
-
18
-
19
-
20
-
21
-
22
-
23
-
24
-
25
-
26
-
27
-
28
-
29
-
30
-
31
-
 32
32 -
 33
33 -
 34
34 -
 35
35 -
 36
36 -
 37
37 -
 38
38 -
 39
39 -
 40
40 -
 41
41 -
 42
42 -
 43
43 -
 44
44 -
 45
45 -
 46
46 -
 47
47 -
 48
48 -
 49
49 -
 50
50 -
 51
51 -
 52
52 -
53
-
54
-
55
-
56
-
57
-
58
-
59
-
60
-
61
-
62
-
63
-
64
-
65
-
66
-
67
-
68
-
69
-
70
-
71
-
72
-
73
-
74
-
75
-
76
-
77
-
78
-
79
-
80
-
81
-
82
-
83
-
84
-
85
-
86
-
87
-
88
-
89
-
90
 |
 |

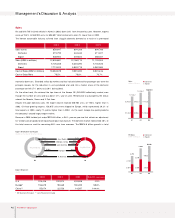
Sales
Kia sold 319,795 finished vehicles in Korea in 2003, down 28% from the previous year. However, exports
were up 19.8% to 538,902 units, for 858,697 total finished units sold, 4% lower than in 2002.
The Korean automobile industry suffered from sluggish domestic demand as a result of a protracted
economic downturn. Extended strikes by workers and less industrial demand for passenger cars were the
principle reasons for the reduction in units produced and sold. Kia’s market share of the domestic
passenger car fell 2.7% points to 23.8% during 2003.
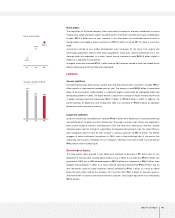
On the other hand, Kia retained the top share of the Korean RV (SUV/MPV collectively) market even
though the number of units sold was down 21% year on year. Performance was buoyed by the robust
sales of the Sorento, Carens and X-Trek lines.
Despite the poor domestic sales, the export volume reached 538,902 units, or 19.8% higher than in
2002. Of these growing exports, 156,675 units were shipped to Europe, which represented 29.2% of
total exports in 2003, nearly 7% points higher than in 2002. As the result, Europe has quickly become
the company’s second largest export market.
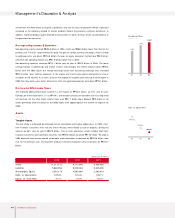
Revenue in 2003 totaled just under ₩12.84 trillion, a 5.6% year-on-year rise that reflects an adjustment
for vendor sales of goods to be repurchased post-manufacture. The domestic market represented 40% of
the total revenue, and the remaining 60% was from overseas. The ₩618.8 billion growth in total
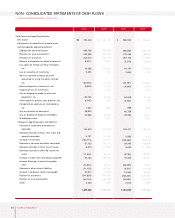
Sales (Units)
Domestic
Export
Sales (KRW in millions)
Domestic
Export
Cost of Sales (KRW in millions)
Cost of Sales Ratio
2003
858,697
319,795
538,902
12,839,881
5,126,358
7,713,523
10,084,078
78.5%
894,268
444,444
449,824
12,158,113
6,304,394
5,853,719
9,581,392
78.8%
899,788
411,321
488,467
11,129,204
5,146,620
5,982,584
8,531,616
76.7%
2002 2001
Management’s Discussion & Analysis
42 Kia Motors Corporation
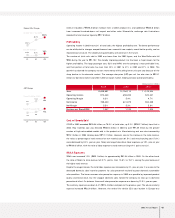
Export Breakdown by Region
(Based on Number of Shipment Units)
Export Shipment
(Units)
538,902 Units
02
9.4%
7.7%
5.5%
29.2%
48.2%
03
* KD Shipments Excluded * * Local Production Included
U.S
Europe*
China* *
2003
229,426
156,675
55,074
222,872
98,665
22,536
233,008
100,499
14,587
2.9%
58.8%
144.4%
2002 2001 Growth (2003-2002)
Sales
(KRW in Billions)
11,129.2
5,146.6
5,982.6
12,158.1
6,304.4
5,853.7
12,839.9
5,126.4
7,713.5
01 02 03
RV Sales
(KRW in Billions)
4,259
2,064
2,195
6,060
3,190
2,870
6,648
2,625
4,023
01 02 03
■Domestic
■Export
■Domestic
■Export
Asia / Pacific
Mid East / Africa
Latin America
Europe
N. America
449,824 Units
55.2%
21.9%
7.2%
8.1%
7.6%