Kia 2003 Annual Report Download - page 48
Download and view the complete annual report
Please find page 48 of the 2003 Kia annual report below. You can navigate through the pages in the report by either clicking on the pages listed below, or by using the keyword search tool below to find specific information within the annual report.-
 1
1 -
2
-
3
-
4
-
5
-
6
-
7
-
8
-
9
-
10
-
11
-
12
-
13
-
14
-
15
-
16
-
17
-
18
-
19
-
20
-
21
-
22
-
23
-
24
-
25
-
26
-
27
-
28
-
29
-
30
-
31
-
32
-
33
-
34
-
35
-
36
-
37
-
 38
38 -
 39
39 -
 40
40 -
 41
41 -
 42
42 -
 43
43 -
 44
44 -
 45
45 -
 46
46 -
 47
47 -
 48
48 -
 49
49 -
 50
50 -
 51
51 -
 52
52 -
 53
53 -
 54
54 -
 55
55 -
 56
56 -
 57
57 -
 58
58 -
59
-
60
-
61
-
62
-
63
-
64
-
65
-
66
-
67
-
68
-
69
-
70
-
71
-
72
-
73
-
74
-
75
-
76
-
77
-
78
-
79
-
80
-
81
-
82
-
83
-
84
-
85
-
86
-
87
-
88
-
89
-
90
 |
 |
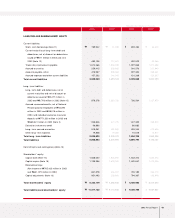
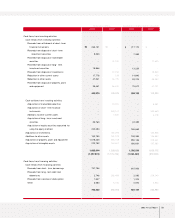
NON-CONSOLIDATED BALANCE SHEETS
▶AS OF DECEM BER 31, 2003 AND 2002
48 Kia Motors Corporation
Korean won (in millions) Translation into U.S.dollars (in thousands)
ASSETS
Current assets:
Cash and cash equivalents
Short-term financial instruments
Marketable securities (Note 6)
Trade notes and accounts receivable, net of
unamortized present value discount of
₩771 million in 2003 and ₩2,540 million in
2002, and allowance for doubtful accounts
of ₩212,553 million in 2003 and ₩217,738
million in 2002
Inventories (Notes 3 and 8)
Other receivables, net of unamortized present
value discount of ₩5,734 million in 2003,
and ₩9,638 million in 2002 and allowance
for doubtful accounts of ₩109,382 million
in 2003 and ₩102,971 million in 2002
Advances and other current assets, net of
allowance for doubtful accounts of
₩33,822 million in 2003 and ₩32,524
million in 2002
Total current assets
Non-current assets:
Long-term investment securities, net of
unamortized present value discount of
₩5,234 million in 2003 (Note 4)
Equity securities accounted for using the equity
method (Note 5)
Investments, net of unamortized present value
discount of ₩23,341 million in 2002
(Note 6)
Property, plant and equipment, net of
accumulated depreciation of ₩2,151,627
million in 2003 and ₩1,882,817 million in
2002 (Notes 7 and 8)
Intangibles, net of amortization (Note 9)
Other assets (Note 10)
Deferred income tax assets (Note 18)
Total non-current assets
Total assets
1,438,661
500,000
-
460,910
675,739
125,818
50,166
3,251,294
1,237,217
719,705
-
4,663,360
453,814
268,397
617,345
7,959,838
11,211,132
₩
₩
2003 2002 2003 2002
763,739
760,131
19,565
589,040
485,018
147,123
156,717
2,921,333
-
378,281
499,775
4,166,854
299,724
240,338
606,343
6,191,315
9,112,648
1,201,086
417,432
-
384,797
564,150
105,042
41,881
2,714,388
1,032,908
600,856
-
3,893,270
378,873
224,075
515,399
6,645,381
9,359,769
637,618
634,606
16,335
491,768
404,924
122,827
130,838
2,438,916
-
315,814
417,243
3,478,757
250,228
200,649
506,214
5,168,905
7,607,821
₩
₩
$
$
$
$