Kia 2003 Annual Report Download - page 79
Download and view the complete annual report
Please find page 79 of the 2003 Kia annual report below. You can navigate through the pages in the report by either clicking on the pages listed below, or by using the keyword search tool below to find specific information within the annual report.-
 1
1 -
2
-
3
-
4
-
5
-
6
-
7
-
8
-
9
-
10
-
11
-
12
-
13
-
14
-
15
-
16
-
17
-
18
-
19
-
20
-
21
-
22
-
23
-
24
-
25
-
26
-
27
-
28
-
29
-
30
-
31
-
32
-
33
-
34
-
35
-
36
-
37
-
38
-
39
-
40
-
41
-
42
-
43
-
44
-
45
-
46
-
47
-
48
-
49
-
50
-
51
-
52
-
53
-
54
-
55
-
56
-
57
-
58
-
59
-
60
-
61
-
62
-
63
-
64
-
65
-
66
-
67
-
68
-
 69
69 -
 70
70 -
 71
71 -
 72
72 -
 73
73 -
 74
74 -
 75
75 -
 76
76 -
 77
77 -
 78
78 -
 79
79 -
 80
80 -
 81
81 -
 82
82 -
 83
83 -
 84
84 -
 85
85 -
 86
86 -
 87
87 -
 88
88 -
 89
89 -
90
 |
 |
2003 Annual Report 79
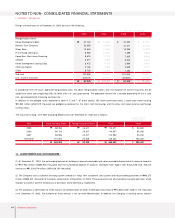
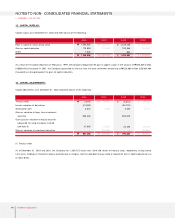
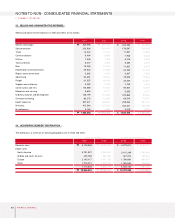
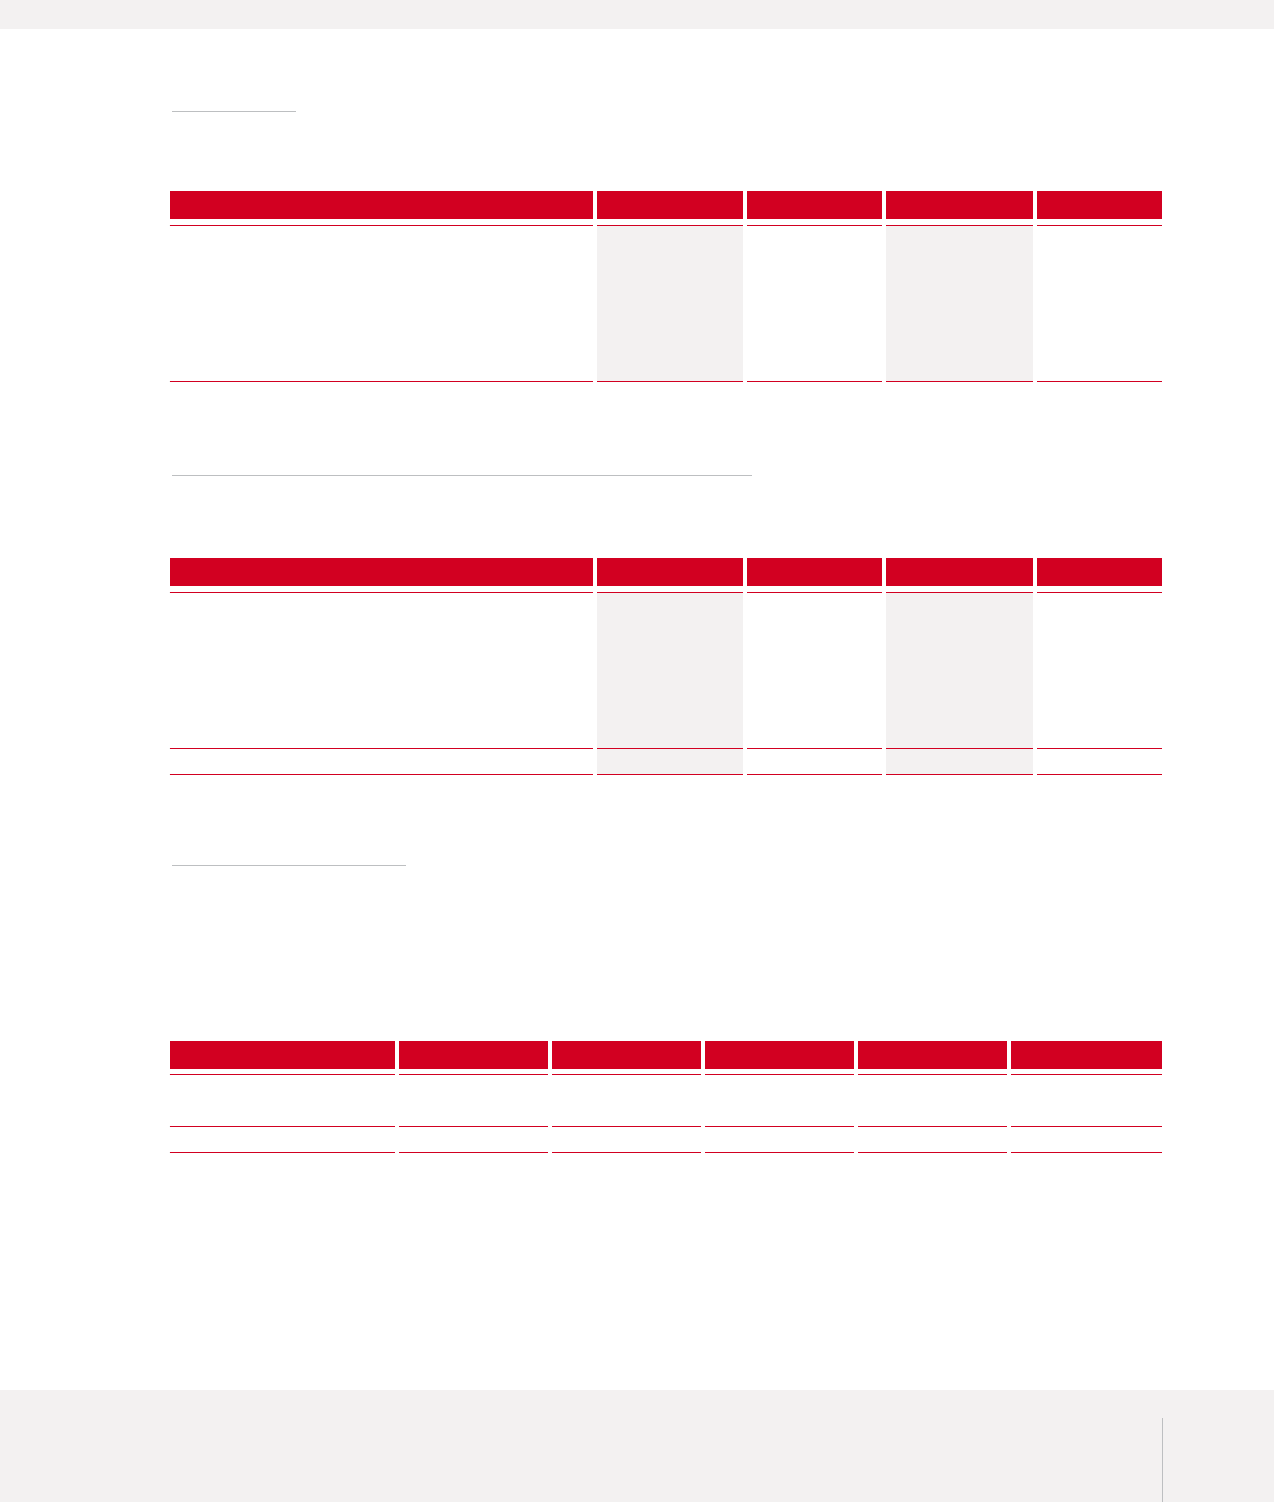
19. DIVIDENDS :
The computation of the proposed dividends in 2003 and 2002 is as follows :
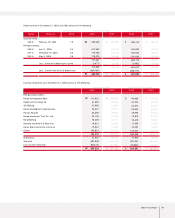
20. SUPPLEM ENTARY INFORM ATION FOR COM PUTATION OF VALUE ADDED :
The accounts and amounts needed for calculation of value added are as follows :
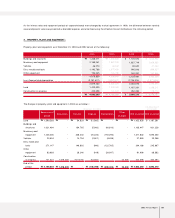
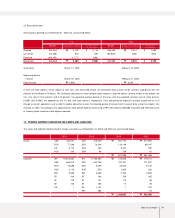
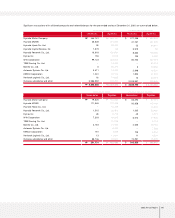
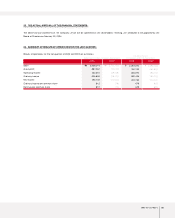
21. DERIVATIVE INSTRUM ENT :
The Company has entered into derivative instrument contracts to hedge the exposure to variability in expected future cash flows of forecasted
export sales that is attributable to changes in foreign exchange rate.
Derivative instrument contracts as of December 31, 2003 are summarized below.
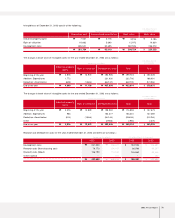
The effective portion of the derivative contracts for cash flow hedging purpose from forecasted export sales recorded as a capital adjustment,
amounting ₩41,599 million (US$34,730 thousand) as of December 31, 2003, all of which were included in the determination of net income in
2004 and the ineffective portion of the derivative contracts recorded in current operations, amounting ₩48,820 million (US$40,758 thousand)
2003 2002 2003 2002
Korean won (in millions, except per share amount) U.S. dollars (Note 2)
(in thousands, except per share amount)
Number of shares eligible for dividend
Face value per share
Face value dividend rate
Dividend
Dividend to net income
Dividend yield ratio
358,420,732
5,000
7%
125,448
17.8%
3.4%
368,121,297
5,000
5%
92,030
14.3%
2.6%
₩₩
358,420,732
4
7%
104,731
17.8%
3.4%
368,121,297
4
5%
76,833
14.3%
2.6%
$$
2003 2002 2003 2002
Korean won (in millions) U.S. dollars (Note 2) (in thousands)
Ordinary income
Labor costs
Interest expense, net
Rent
Taxes and dues
Depreciation
853,599
1,766,597
(32,837)
13,932
19,521
401,958
3,022,770
801,310
1,609,923
13,865
10,984
20,011
423,486
2,879,579
₩
₩
₩
₩
712,639
1,474,868
(27,414)
11,631
16,297
335,580
2,523,601
668,985
1,344,067
11,575
9,170
16,706
353,553
2,404,056
$
$
$
$
Korean won (in millions)
Contract amounts
(in thousand)
U.S. dollars (Note 2)
(in thousands)
Koram Bank and other
Koram Bank and other
EUR 907,000
EUR 907,000
Fair valueBank
(73,025)
(17,394)
(90,419)
Valuation loss Capital adjustments Fair value
(31,426)
(17,394)
(48,820)
₩
₩
₩
₩
(41,599)
-
(41,599)
₩
₩
(60,966)
(14,522)
(75,488)
$
$