Kia 2003 Annual Report Download - page 44
Download and view the complete annual report
Please find page 44 of the 2003 Kia annual report below. You can navigate through the pages in the report by either clicking on the pages listed below, or by using the keyword search tool below to find specific information within the annual report.-
 1
1 -
2
-
3
-
4
-
5
-
6
-
7
-
8
-
9
-
10
-
11
-
12
-
13
-
14
-
15
-
16
-
17
-
18
-
19
-
20
-
21
-
22
-
23
-
24
-
25
-
26
-
27
-
28
-
29
-
30
-
31
-
32
-
33
-
 34
34 -
 35
35 -
 36
36 -
 37
37 -
 38
38 -
 39
39 -
 40
40 -
 41
41 -
 42
42 -
 43
43 -
 44
44 -
 45
45 -
 46
46 -
 47
47 -
 48
48 -
 49
49 -
 50
50 -
 51
51 -
 52
52 -
 53
53 -
 54
54 -
55
-
56
-
57
-
58
-
59
-
60
-
61
-
62
-
63
-
64
-
65
-
66
-
67
-
68
-
69
-
70
-
71
-
72
-
73
-
74
-
75
-
76
-
77
-
78
-
79
-
80
-
81
-
82
-
83
-
84
-
85
-
86
-
87
-
88
-
89
-
90
 |
 |
Management’s Discussion & Analysis
44 Kia Motors Corporation
shifted from the Head Office to Eurpean subsidiaries, and also the costs for proactive vehicle inspections
increased as the company worked to correct problems before they became customer complaints. In
addition, improved product quality lowered warranty claims in North America, which caused decrease in
the provisions for warranties.
Non-operating Income & Expenses
Non-operating income reached ₩456.2 billion in 2003, which was ₩86.5 billion lower than that for the
previous year. The main factors behind this drop: The gain on foreign currency translation, which is linked
to exchange rates, was down ₩154.8 billion; the gain on equity evaluation method rose ₩9.5 billion,
and other non-operating income was ₩57.9 billion higher than in 2002. .
Non-operating expenses increased ₩15.1 billion year on year to ₩415 billion in 2003. The lower
average balance in borrowings and market interest rates brought the interest expense down ₩43.8
billion from the 2002 figure, but foreign exchange losses from fluctuating exchange rates increased
₩42.5 billion. New facilities expansion at the engine and transmission plants prompted the sale or
shutdown of old facilities. As a result, losses on the disposal of tangible assets were 26.5 billion higher in
2003 than they were a year earlier. Meanwhile, other non-operating expenses were down ₩10.1 billion.
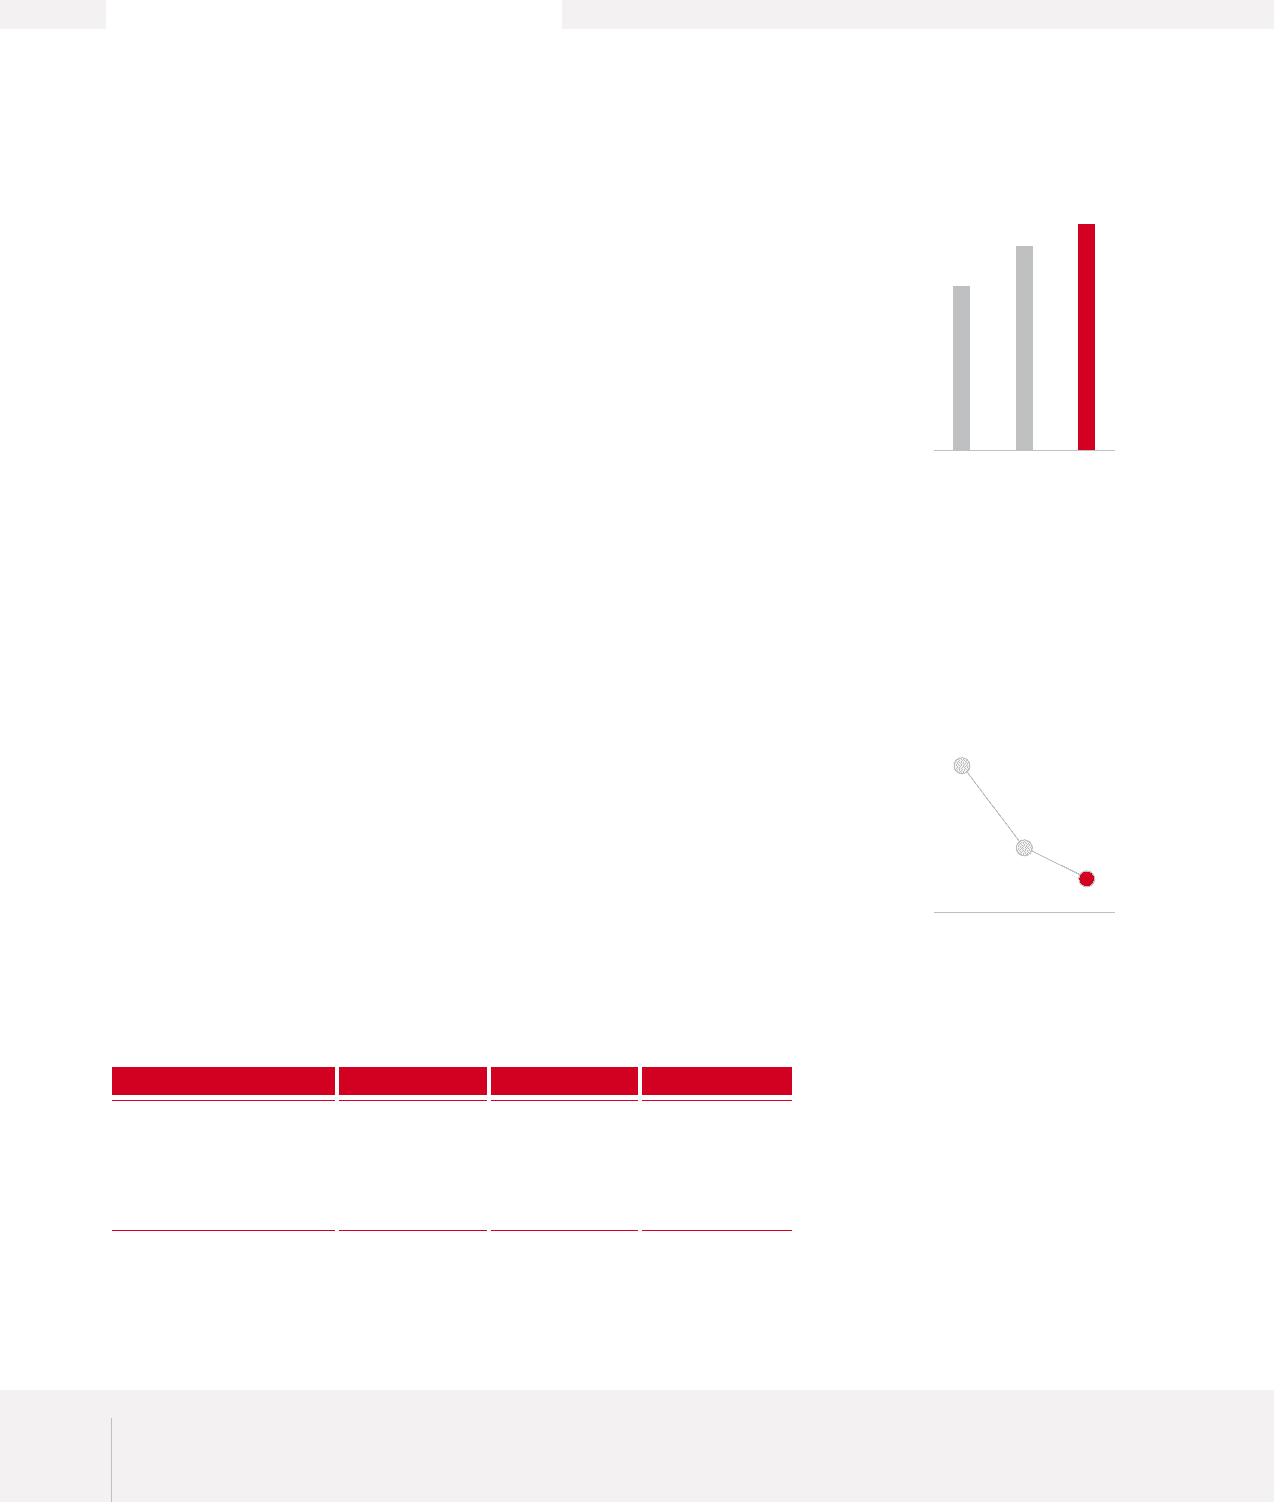
Net Income/ EPS/ Income Taxes
The improved 2003 performance resulted in a net income of ₩705.4 billion, up 10% year on year.
Earnings per share improved 11.7% to ₩1,947, and company officials are confident that this rising trend
will continue. On the other hand, income taxes were ₩11.7 billion lower because ₩20 billion in tax
credits generated since the closure of the 2002 books were applied against the income tax expense for
2003.
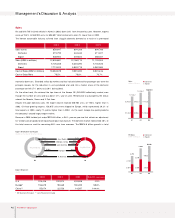
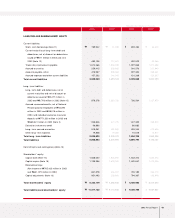
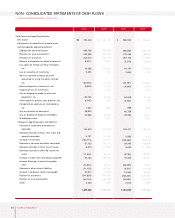
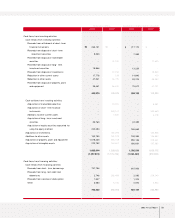
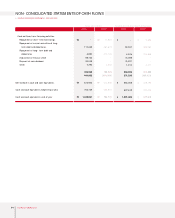
Assets
Tangible Assets
The cash inflow was boosted by increased sales of automobiles with higher added value. In 2003, short-
term financial instruments with maturity within 90 days were treated as cash or deposits, driving this
account up 88% year on year to ₩675 billion. Cash & Cash equivalent, which includes short-term
financial instruments and marketable securities, rose ₩395.3 billion to almost ₩1.94 trillion. The drop in
2003 domestic sales volume caused automobile trade receivables to decrease by ₩139.8 billion from
that for the previous year, while greater product inventories boosted overall inventories by ₩109.7
billion.
Assets
Liabilities
Shareholders’ Equity
Debt-to-Equity Ratio
Equity-to-Asset Ratio
2003
11,211,132
5,868,953
5,342,179
109.9%
47.7%
9,112,648
5,018,964
4,093,684
122.6%
44.9%
8,438,466
5,045,450
3,393,016
148.7%
40.2%
2002 2001
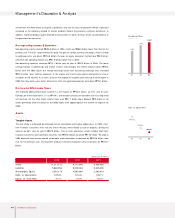
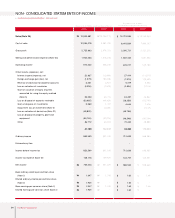
Earnings per Share
(Korean won)
1,424
1,743
1,947
01 02 03
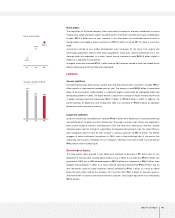
Debt-to-Equity Ratio
148.7%
122.6%
109.9%
01 02 03
(Korean won in millions)