Kia 2003 Annual Report Download - page 76
Download and view the complete annual report
Please find page 76 of the 2003 Kia annual report below. You can navigate through the pages in the report by either clicking on the pages listed below, or by using the keyword search tool below to find specific information within the annual report.-
 1
1 -
2
-
3
-
4
-
5
-
6
-
7
-
8
-
9
-
10
-
11
-
12
-
13
-
14
-
15
-
16
-
17
-
18
-
19
-
20
-
21
-
22
-
23
-
24
-
25
-
26
-
27
-
28
-
29
-
30
-
31
-
32
-
33
-
34
-
35
-
36
-
37
-
38
-
39
-
40
-
41
-
42
-
43
-
44
-
45
-
46
-
47
-
48
-
49
-
50
-
51
-
52
-
53
-
54
-
55
-
56
-
57
-
58
-
59
-
60
-
61
-
62
-
63
-
64
-
65
-
 66
66 -
 67
67 -
 68
68 -
 69
69 -
 70
70 -
 71
71 -
 72
72 -
 73
73 -
 74
74 -
 75
75 -
 76
76 -
 77
77 -
 78
78 -
 79
79 -
 80
80 -
 81
81 -
 82
82 -
 83
83 -
 84
84 -
 85
85 -
 86
86 -
87
-
88
-
89
-
90
 |
 |
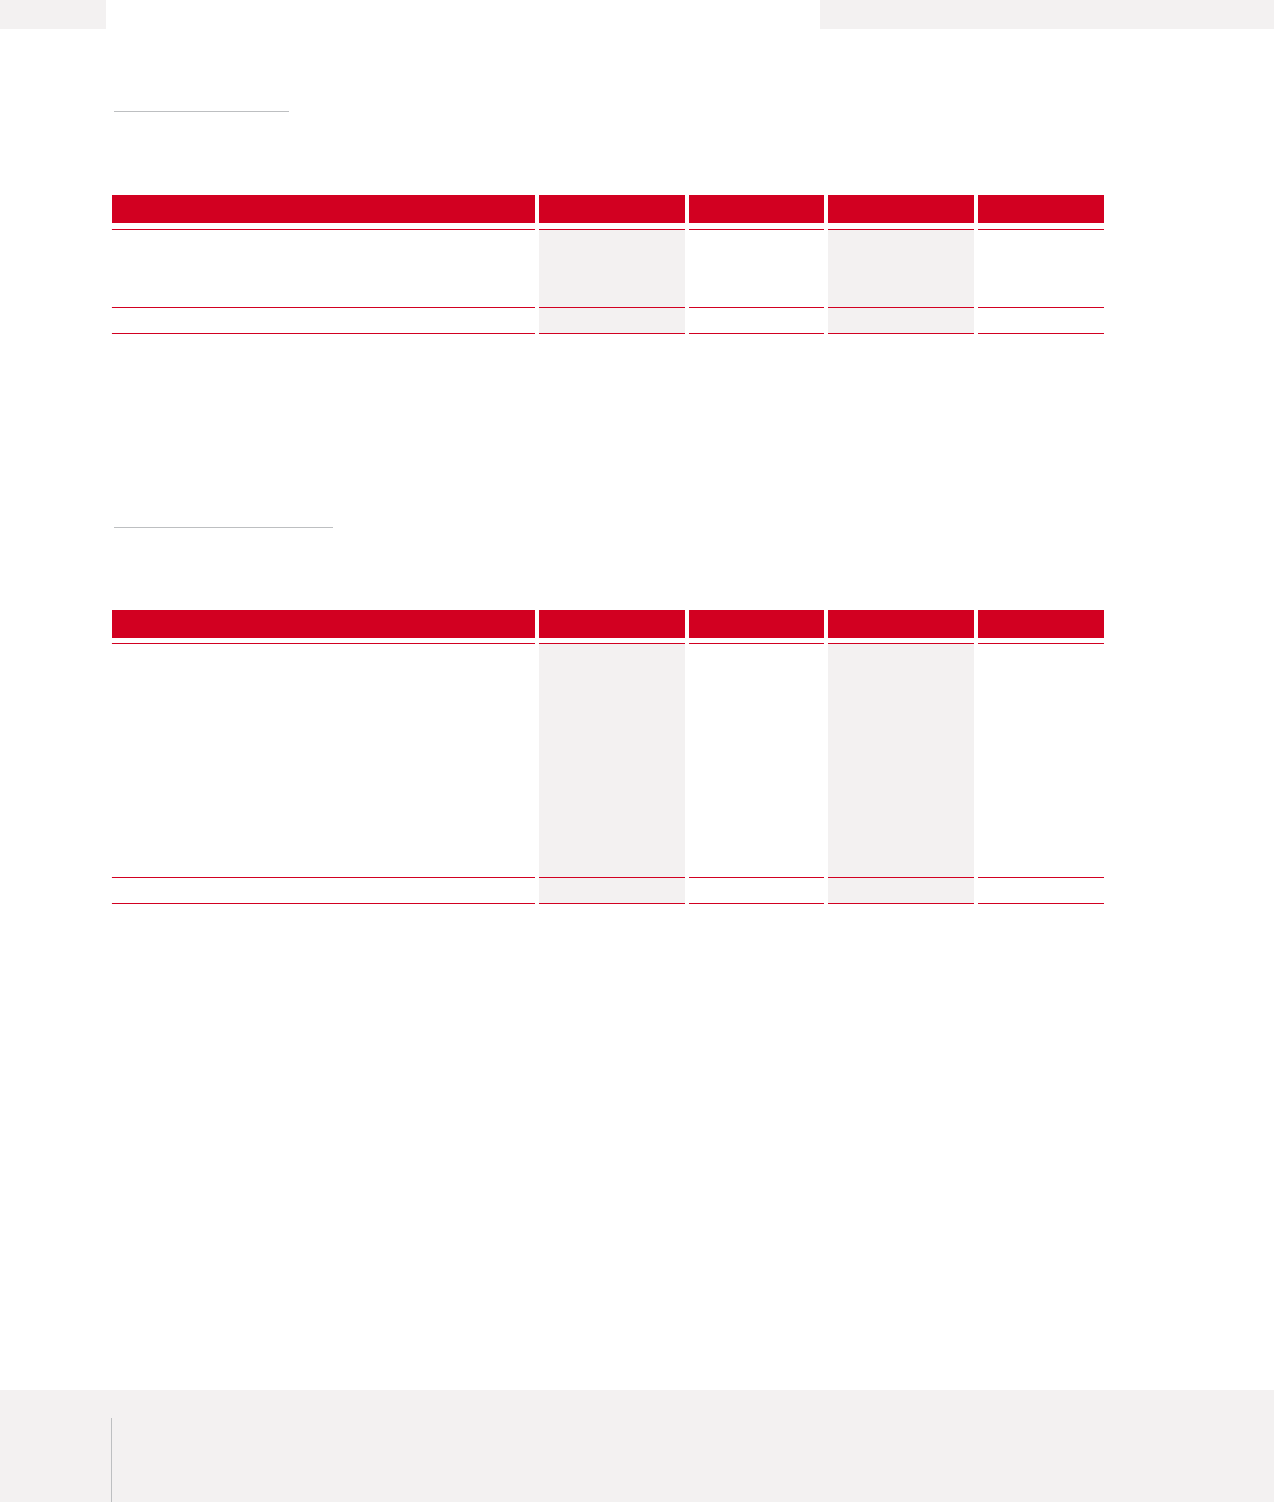
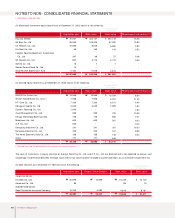
NOTES TO NON-CONSOLIDATED FINANCIAL STATEMENTS
▶DECEMBER 31, 2003 AND 2002
76 Kia Motors Corporation
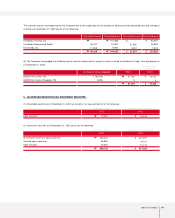
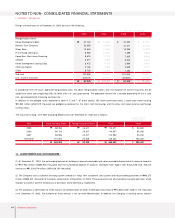
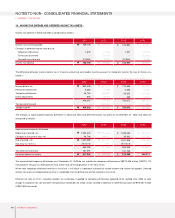
15. CAPITAL SURPLUS :
Capital surplus as of December 31, 2003 and 2002 consist of the following :
As a result of the capital reduction on February 2, 1999, the Company recognized the gain in capital surplus in the amount of ₩340,848 million
(US$284,562 thousand). In 2001, the Company accounted for the loss from the stock retirement amounting to ₩220,989 million (US$184,496
thousand) as a charged against the gain on capital reduction.
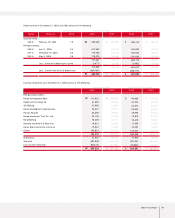
16. CAPITAL ADJUSTM ENTS :
Capital adjustments as of December 31, 2003 and 2002 consist of the following :
(1) Treasury stock
As of December 31, 2003 and 2002, the Company has 1,309,723 shares and 1,609,158 shares of treasury stock, respectively, arising mainly
from cross-holdings of investment equity securities due to mergers, and has recorded treasury stock at acquisition cost in capital adjustments as
of those dates.
2003 2002 2003 2002
Korean won (in millions) U.S. dollars (Note 2) (in thousands)
Paid-in capital in excess of par value
Gain on capital reduction
Other
1,580,065
119,859
1,032
1,700,956
1,580,065
119,859
-
1,699,924
1,319,139
100,066
862
1,420,067
1,319,139
100,066
-
1,419,205
₩
₩
₩
₩
$
$
$
$
2002 2003 2002
Korean won (in millions) U.S. dollars (Note 2) (in thousands)
Treasury stock
Loss on valuation of derivatives
Stock option cost
Gain on valuation of long-term investment
securities
Gain (Loss) on valuation of equity securities
accounted for using the equity method
(see Note 5)
Gain on valuation of investment securities
(7,839)
(41,599)
3,622
969,404
27,905
-
951,493
(9,631)
-
3,735
-
(10,803)
245,380
228,681
(6,544)
(34,729)
3,024
809,320
23,296
-
794,367
(8,040)
-
3,118
-
(9,019)
204,859
190,918
₩
₩
₩
₩
$
$
$
$
2003