Kia 2003 Annual Report Download - page 45
Download and view the complete annual report
Please find page 45 of the 2003 Kia annual report below. You can navigate through the pages in the report by either clicking on the pages listed below, or by using the keyword search tool below to find specific information within the annual report.-
 1
1 -
2
-
3
-
4
-
5
-
6
-
7
-
8
-
9
-
10
-
11
-
12
-
13
-
14
-
15
-
16
-
17
-
18
-
19
-
20
-
21
-
22
-
23
-
24
-
25
-
26
-
27
-
28
-
29
-
30
-
31
-
32
-
33
-
34
-
 35
35 -
 36
36 -
 37
37 -
 38
38 -
 39
39 -
 40
40 -
 41
41 -
 42
42 -
 43
43 -
 44
44 -
 45
45 -
 46
46 -
 47
47 -
 48
48 -
 49
49 -
 50
50 -
 51
51 -
 52
52 -
 53
53 -
 54
54 -
 55
55 -
56
-
57
-
58
-
59
-
60
-
61
-
62
-
63
-
64
-
65
-
66
-
67
-
68
-
69
-
70
-
71
-
72
-
73
-
74
-
75
-
76
-
77
-
78
-
79
-
80
-
81
-
82
-
83
-
84
-
85
-
86
-
87
-
88
-
89
-
90
 |
 |
2003 Annual Report 45
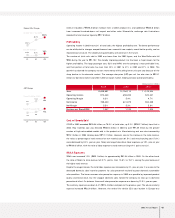
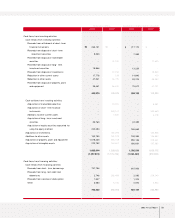
Fixed Assets
The acquisition of affiliated company stocks and capital increases at overseas subsidiaries to ensure
smooth parts supply and boost exports caused long-term investment securities and equity method gains
to grow ₩214.4 billion year on year. Increases in the share prices for marketable securities such as
Hyundai Mobis also helped to boost investments of ₩819.4 billion to almost ₩1.12 trillion at the end of
2003.
Investments related to new model development were increased. At the same time, engine and
transmission production facilities were either expanded or newly built, and the production line at the
Gwangju plant was expanded. As a result, overall annual investments were ₩494.5 billion higher in
2003 than it had been the year before.
Intangible assets also increased ₩154.1 billion because R&D expenses related to such new models as the
Sorento, Morning and KM mini-SUV were capitalized.
Liabilities
Current Liabilities
Increased overseas sales drove up raw material costs and parts procurement, resulting in a modest ₩96.3
billion growth in trade accounts payable year on year. The company issued ₩500 billion in commercial
paper to ensure constant usable liquidity in a domestic capital market beset by widespread credit card
delinquency problems in 2003. The higher banker’s usance from a change in import methods and the rise
in exports elevated short-term borrowings ₩147.7 billion to ₩748.6 billion in 2003. In addition, the
current portions of debentures and of long-term debt was increased to ₩369.6 billion as corporate
bonds came within one year of maturity.
Long-term Liabilities
Long-term borrowings and debentures totaling ₩480.4 billion were redeemed as matured borrowings
and reclassified on the books as current borrowings. The surge in overseas sales volume was expected to
boost overall warranty provision (including both short and long term) significantly. However, steadily
improved quality and the shifting of responsibility for European ELV provision from the Head Office to
local subsidiaries kept the year-on-year increase in warranty provision to ₩27.8 billion. Kia Motors
engaged in various derivative transactions in 2003, and a rising exchange rate at the end of the
accounting year caused a temporary loss on evaluation. Derivative instruments credit has increased by
₩96.9 billion from the 2002 figure.
Shareholders’ Equity
The stock option rights granted in year 2000 were exercised to generate a ₩1 billion gain on the
disposition of treasury stock, causing capital surplus to rise in 2003. A net income of ₩705.4 billion was
generated in 2003, but a 2002 dividend payout of ₩92.0 billion was followed by a ₩88.7 billion share
buyback and cancellation in 2003. As a result, retained earnings increased only ₩524.6 billion year on
year. Meanwhile, profit on paper (valuation income) increased to ₩762.7 billion as a result of higher
prices for listed stocks held by the company. On the other hand, ₩41.6 billion of valuation losses of
short-term(within 12 months) derivative investments occured. Total Capital adjustment was increased by
₩722.8 billion.
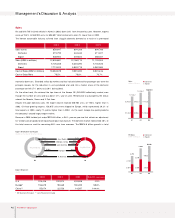
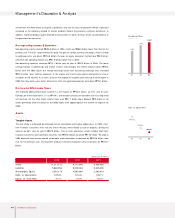
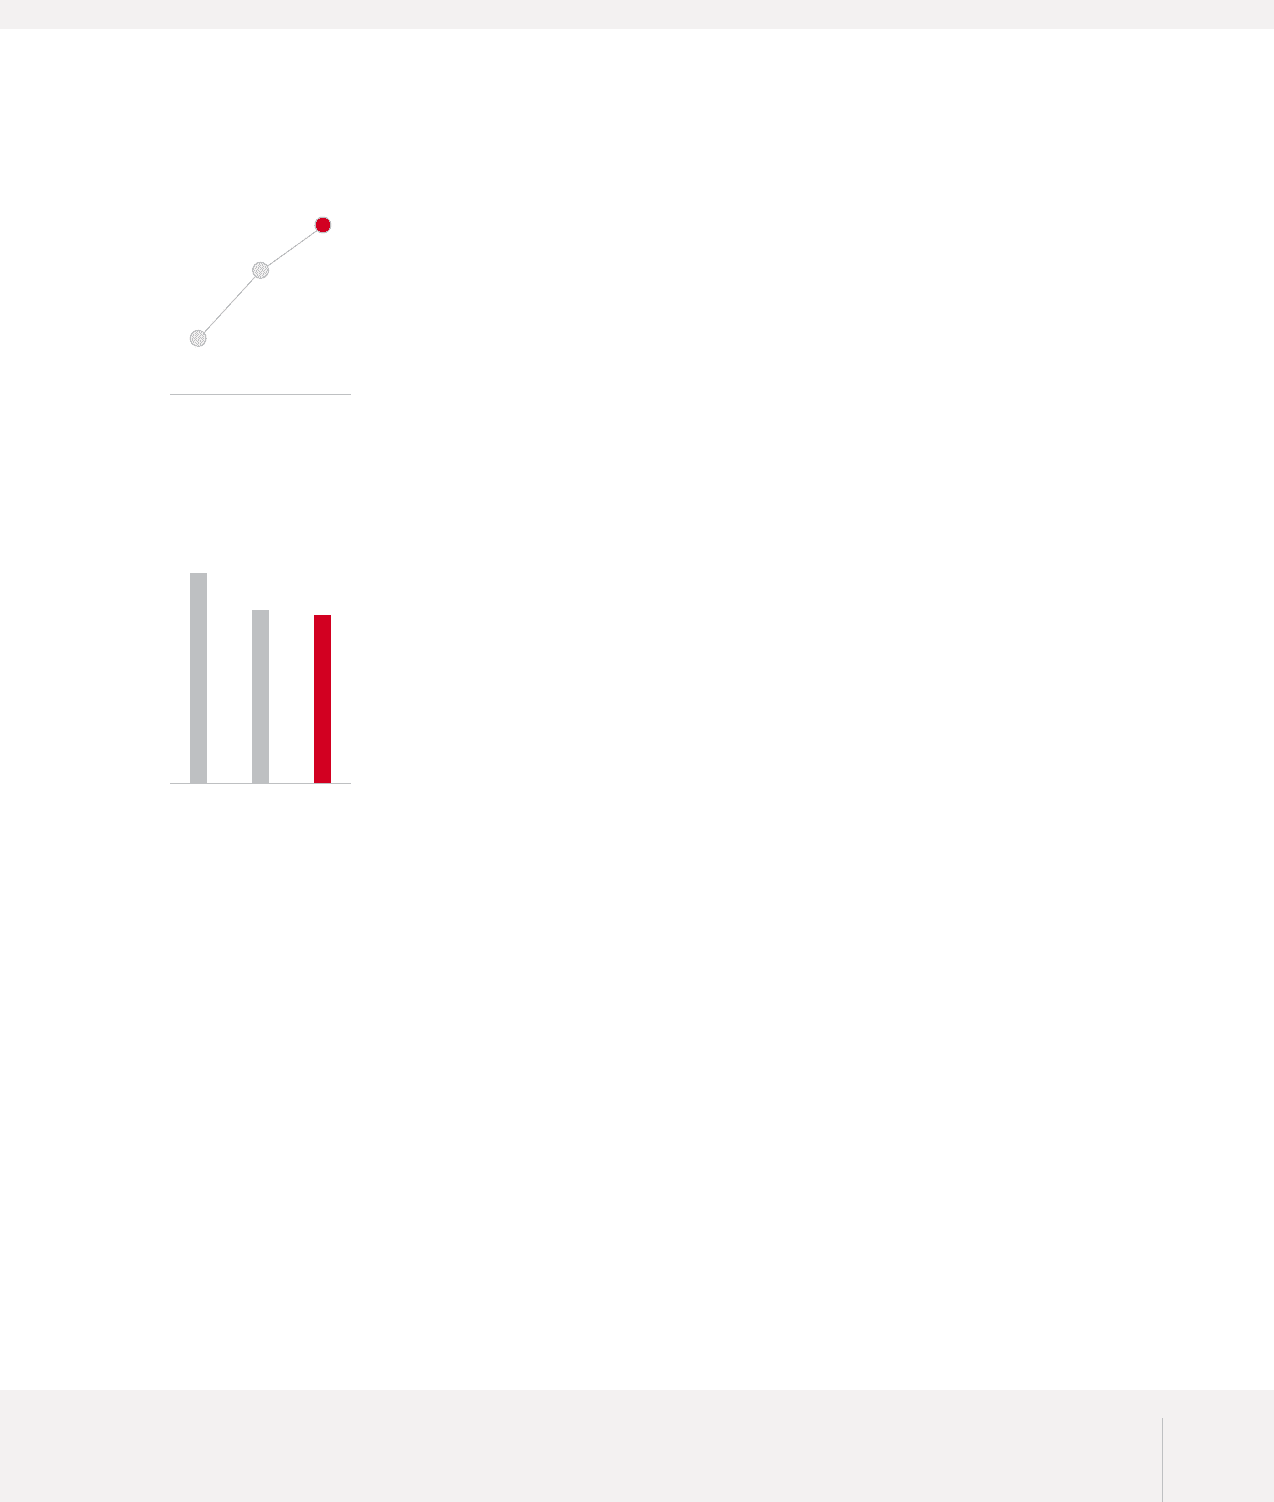
Change in Number of Shares
(Shares in Millions)
449
369 359
00 02 03
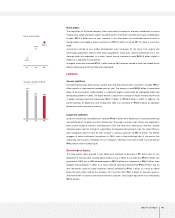
Equity-to-Asset Ratio
40.2%
44.9% 47.7%
01 02 03