Kia 2003 Annual Report Download - page 33
Download and view the complete annual report
Please find page 33 of the 2003 Kia annual report below. You can navigate through the pages in the report by either clicking on the pages listed below, or by using the keyword search tool below to find specific information within the annual report.-
 1
1 -
2
-
3
-
4
-
5
-
6
-
7
-
8
-
9
-
10
-
11
-
12
-
13
-
14
-
15
-
16
-
17
-
18
-
19
-
20
-
21
-
22
-
 23
23 -
 24
24 -
 25
25 -
 26
26 -
 27
27 -
 28
28 -
 29
29 -
 30
30 -
 31
31 -
 32
32 -
 33
33 -
 34
34 -
 35
35 -
 36
36 -
 37
37 -
 38
38 -
 39
39 -
 40
40 -
 41
41 -
 42
42 -
 43
43 -
44
-
45
-
46
-
47
-
48
-
49
-
50
-
51
-
52
-
53
-
54
-
55
-
56
-
57
-
58
-
59
-
60
-
61
-
62
-
63
-
64
-
65
-
66
-
67
-
68
-
69
-
70
-
71
-
72
-
73
-
74
-
75
-
76
-
77
-
78
-
79
-
80
-
81
-
82
-
83
-
84
-
85
-
86
-
87
-
88
-
89
-
90
 |
 |

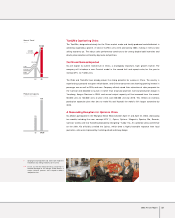
Kia M otors
January 2003 February March April May June July August September October November December
130
(% )
125
120
115
110
105
100
95
90
85
80
75
KOSPI
2003 Annual Report 33
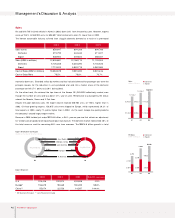
KIA M otors Share Price vs. KOSPI
The price of Kia Motors stock moved along with the composite price index early in 2003, but fell below the average rate of share price changes from July.
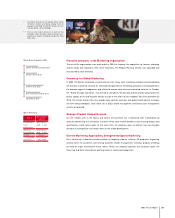
Kia shares indicated the first signs of a rebound in October and were back on pace with the overall market by year’s end. The reasons Continued labor
unrest in July and August and a general economic downturn in Korea kept the share prices low through the third quarter. However, domestic sales rose in
the fourth quarter and overseas operations outperformed original expectations, enabling the company to achieve its 2003 performance targets. Kia
management is resolutely determined to achieve even better results in the year ahead to boost value for the investor.
2003
No. of Shares (in thousands)
Stock Price(Based on the Closing price, KRW)
Liability / Equity
Total Debt / Total Asset
Net Debt / Equity
Total Debt / EBITDA
EBITDA / Interest Expense
PER (Price Earnings Ratio)
EPS (Earnings per Share, KRW)
ROE (Return on Equity)
EV / EBITDA
Equity held by Foreigners
Dividend Rate
Dividend Propensity
359,730
10,900
109.9%
19.1%
3.8%
1.67x
11.90x
5.64x
1,947
14.95%
3.22x
33.10%
7%
17.8%
2002
369,730
8,800
122.6%
16.5%
Net Cash
1.35x
7.39x
5.05x
1,743
17.13%
2.88x
17.26%
5%
14.35%
2001
369,597
8,860
148.7%
24.4%
40.5%
2.11x
5.15x
6.22x
1,424
17.11%
4.77x
13.41%
-
-