Kia 2003 Annual Report Download - page 43
Download and view the complete annual report
Please find page 43 of the 2003 Kia annual report below. You can navigate through the pages in the report by either clicking on the pages listed below, or by using the keyword search tool below to find specific information within the annual report.-
 1
1 -
2
-
3
-
4
-
5
-
6
-
7
-
8
-
9
-
10
-
11
-
12
-
13
-
14
-
15
-
16
-
17
-
18
-
19
-
20
-
21
-
22
-
23
-
24
-
25
-
26
-
27
-
28
-
29
-
30
-
31
-
32
-
 33
33 -
 34
34 -
 35
35 -
 36
36 -
 37
37 -
 38
38 -
 39
39 -
 40
40 -
 41
41 -
 42
42 -
 43
43 -
 44
44 -
 45
45 -
 46
46 -
 47
47 -
 48
48 -
 49
49 -
 50
50 -
 51
51 -
 52
52 -
 53
53 -
54
-
55
-
56
-
57
-
58
-
59
-
60
-
61
-
62
-
63
-
64
-
65
-
66
-
67
-
68
-
69
-
70
-
71
-
72
-
73
-
74
-
75
-
76
-
77
-
78
-
79
-
80
-
81
-
82
-
83
-
84
-
85
-
86
-
87
-
88
-
89
-
90
 |
 |

2003 Annual Report 43
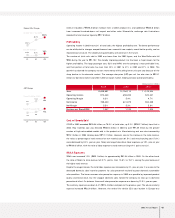
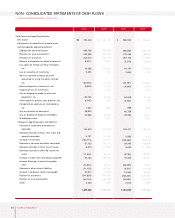
revenue included a ₩495.8 billion increase from a better product mix, and additional ₩203.8 billion
from increased knocked-down unit export and other sales. Meanwhile, exchange rate fluctuations
reduced the total revenue figure by ₩17.8 billion.
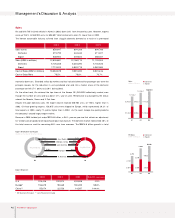
Profitability
Operating income in 2003 was 6.3% of total sales, the highest profitability ever. The better performance
can be attributed to stronger competitiveness from successful new models, overall better quality, and an
improved cost structure. The steadily rising profitability will continue in the future.
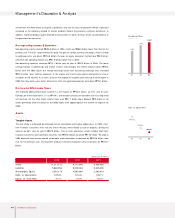
The number of total units sold in 2003 was lower than the 2002 figure, and the Won/Dollar rate fell
₩52 during the year to ₩1,192. The steadily improving product mix has been a major reason for the
higher profitability. The large passenger cars, SUVs and MPVs are the company’s most profitable lines,
and their portion of total sales has risen from 33% in 2001 to 41% in 2002 and 47% in 2003. This
growth has allowed the company to earn more money while selling fewer units per year because of the
sharp decline in the domestic market. The average sales price (ASP) per unit has also risen to ₩15.1
million for domestic market and US$11,200 for export market, helping to boost overall profitability.
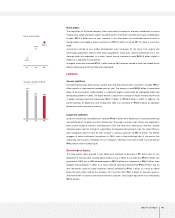
Cost of Goods Sold
COGS in 2003 exceeded ₩10.84 trillion, or 78.5% of total sales, up 5.2% (₩502.7 billion) from that in
2002. Raw materials cost was elevated ₩380.3 billion in 2003 to over ₩7.89 trillion by the greater
number of high-value-added models sold in the product mix. Manufacturing cost was also increased by
₩13.1 billion in 2003 totaling about ₩1.12 trillion. However, due to the increase in the total revenue,
the ratios as percentage of total revenue for raw materials cost (61.5% ) and manufacturing cost (7.8% )
were decreased by 0.3% year-on-year. Salary and wage hikes drove labor expenses up 10% year on year
to ₩109.3 billion, with the ratio of labor expense to total revenue rising 0.4% points to 9.2% .
SG&A Expenses
SG&A was increased 1.3% (₩25.1 billion) to approximately ₩1.94 trillion in 2003. On the other hand,
the ratio of SG&A to total revenue fell 0.7% points, from 15.8% to 15.1% during the year because of
the higher total revenue.
Despite the wage increase, the total labor expense was increased only 3% year on year. It was due to the
decreased domestic sales incentive payment for sales personnel resulted by poor domestic automobile
sales condition. The lower overseas sales promotion expense in 2003 was possible by improved product
quality and brand value, but the sluggish domestic sales forced the company to step up its domestic
promotional effort. On balance, the overall sales promotion expense was down by 12.3% year-on-year.
The warranty expense was down 3.4% (₩14.4 billion) compare to the previous year. The actual warranty
expense increased ₩32.9 billion. However, the end-of-life vehicle (ELV) cost burden in Europe was
ASP Change
9.4
12.1
9.9
13.6 15.1
11.2
01 02 03
Domestic (Million KRW)
Export (Thousand US$)
Product Mix Change
0.5% 0.3% 2.6%
01 02 03
32.3%
44.6%
RV (SUV, Mini-Van, MPV)
Full Size Passenger
Sales
Operating Income
Operating Margin
Net Income
Net Margin
Earnings per Share(KRW)
2003
12,839,881
812,440
6.3%
705,423
5.5%
1,947
12,158,113
658,493
5.4%
641,379
5.3%
1,743
11,129,204
522,241
4.7%
552,235
5.0%
1,424
2002 2001
40.7%
(Korean won in millions)