Kia 2003 Annual Report Download - page 54
Download and view the complete annual report
Please find page 54 of the 2003 Kia annual report below. You can navigate through the pages in the report by either clicking on the pages listed below, or by using the keyword search tool below to find specific information within the annual report.-
 1
1 -
2
-
3
-
4
-
5
-
6
-
7
-
8
-
9
-
10
-
11
-
12
-
13
-
14
-
15
-
16
-
17
-
18
-
19
-
20
-
21
-
22
-
23
-
24
-
25
-
26
-
27
-
28
-
29
-
30
-
31
-
32
-
33
-
34
-
35
-
36
-
37
-
38
-
39
-
40
-
41
-
42
-
43
-
 44
44 -
 45
45 -
 46
46 -
 47
47 -
 48
48 -
 49
49 -
 50
50 -
 51
51 -
 52
52 -
 53
53 -
 54
54 -
 55
55 -
 56
56 -
 57
57 -
 58
58 -
 59
59 -
 60
60 -
 61
61 -
 62
62 -
 63
63 -
 64
64 -
65
-
66
-
67
-
68
-
69
-
70
-
71
-
72
-
73
-
74
-
75
-
76
-
77
-
78
-
79
-
80
-
81
-
82
-
83
-
84
-
85
-
86
-
87
-
88
-
89
-
90
 |
 |
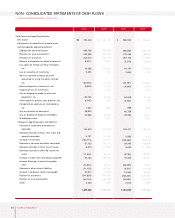
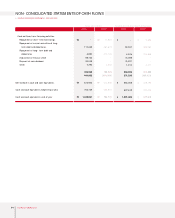
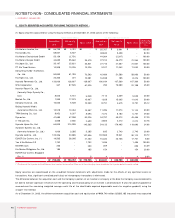
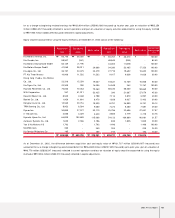
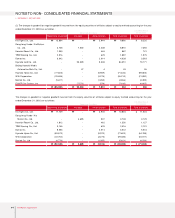
NON-CONSOLIDATED STATEMENTS OF CASH FLOWS
▶FOR THE YEARS ENDED DECEMBER 31, 2003 AND 2002
54 Kia Motors Corporation
2003 2002 2003 2002
Korean won (in millions) Translation into U.S. dollars (Note 2) (in thousands)
Cash outflows from financing activities:
Repayment of short-term borrowings
Repayment of current maturities of long-
term debt and debentures
Repayment of long-term debt and
debentures
Acquisition of treasury stock
Payment of cash dividend
Other
Net increase in cash and cash equivalents
Cash and cash equivalents, beginning of year
Cash and cash equivalents, end of year
9,859
306,962
314,848
-
-
2,217
633,886
(409,921)
428,193
209,425
637,618
-
94,031
4,076
74,088
76,827
1,912
250,934
371,233
563,468
637,618
1,201,086
11,809
367,679
377,125
-
-
2,656
759,269
(491,004)
512,890
250,849
763,739
-
112,630
4,882
88,742
92,023
2,292
300,569
444,663
674,922
763,739
1,438,661
₩
₩
₩
₩
₩
₩
$
$
$
$
$
$