IHOP 2015 Annual Report Download - page 79
Download and view the complete annual report
Please find page 79 of the 2015 IHOP annual report below. You can navigate through the pages in the report by either clicking on the pages listed below, or by using the keyword search tool below to find specific information within the annual report.-
 1
1 -
2
-
3
-
4
-
5
-
6
-
7
-
8
-
9
-
10
-
11
-
12
-
13
-
14
-
15
-
16
-
17
-
18
-
19
-
20
-
21
-
22
-
23
-
24
-
25
-
26
-
27
-
28
-
29
-
30
-
31
-
32
-
33
-
34
-
35
-
36
-
37
-
38
-
39
-
40
-
41
-
42
-
43
-
44
-
45
-
46
-
47
-
48
-
49
-
50
-
51
-
52
-
53
-
54
-
55
-
56
-
57
-
58
-
59
-
60
-
61
-
62
-
63
-
64
-
65
-
66
-
67
-
68
-
 69
69 -
 70
70 -
 71
71 -
 72
72 -
 73
73 -
 74
74 -
 75
75 -
 76
76 -
 77
77 -
 78
78 -
 79
79 -
 80
80 -
 81
81 -
 82
82 -
 83
83 -
 84
84 -
 85
85 -
 86
86 -
 87
87 -
 88
88 -
 89
89 -
90
-
91
-
92
-
93
-
94
-
95
-
96
-
97
-
98
-
99
-
100
-
101
-
102
-
103
-
104
-
105
-
106
-
107
-
108
-
109
-
110
-
111
-
112
-
113
-
114
-
115
-
116
-
117
-
118
-
119
-
120
 |
 |

DineEquity, Inc. and Subsidiaries
Notes to the Consolidated Financial Statements (Continued)
2. Basis of Presentation and Summary of Significant Accounting Policies (Continued)
59
each (one Applebee's franchisee and one franchisee with cross-brand ownership). These franchisees operated 895 Applebee's
and IHOP restaurants in the United States, which comprised 26% of the total Applebee's and IHOP franchise and area license
restaurants in the United States. Revenues from these franchisees represented 15.1% and 13.2%, of total consolidated revenue
for the years ended December 31, 2015 and 2014, respectively, with no single franchisee representing more than 10% of total
consolidated revenue in either year. Receivables from these franchisees totaled $19.0 million and $17.0 million at
December 31, 2015 and 2014, respectively.
Cash and Cash Equivalents
The Company considers all highly liquid investment securities with remaining maturities at the date of purchase of three
months or less to be cash equivalents. These cash equivalents are stated at cost which approximates market value. Cash held
related to IHOP advertising funds and the Company's gift card programs is classified as unrestricted cash as there are no
restrictions on the use of these funds. Total cash balances related to the IHOP advertising funds and the Company's gift card
programs were $72.3 million and $56.2 million as of December 31, 2015 and 2014, respectively.
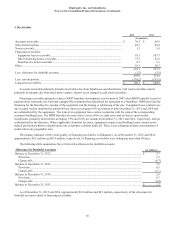
Restricted Cash
Current
Current restricted cash of $32.5 million at December 31, 2015 consisted of $28.4 million of funds required to be held in
trust in connection with the Company's securitized debt and $4.1 million of funds from Applebee's franchisees pursuant to
franchise agreements, usage of which was restricted to advertising activities. Current restricted cash of $52.3 million at
December 31, 2014 consisted of $52.1 million of funds required to be held in trust in connection with the Company's
securitized debt and $0.2 million of funds from Applebee's franchisees pursuant to franchise agreements, usage of which was
restricted to advertising activities.
Non-current
Non-current restricted cash of $14.7 million as of December 31, 2015 and 2014 represents interest reserves required to be
set aside for the duration of the securitized debt and is included in other non-current assets, net in the consolidated balance
sheets.
Property and Equipment
Property and equipment are stated at cost, net of accumulated depreciation. Properties under capital leases are stated at the
present value of the minimum lease payments. Depreciation is computed using the straight-line method over the estimated
useful lives of the assets or remaining useful lives. Leasehold improvements and properties under capital leases are amortized
on a straight-line basis over their estimated useful lives or the lease term, if less. The Company has capitalized certain costs
incurred in connection with the development of internal-use software which are included in equipment and fixtures and
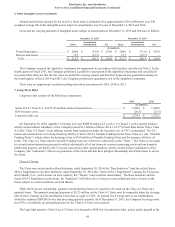
amortized over the expected useful life of the asset. The general ranges of depreciable and amortizable lives are as follows:
Category Depreciable Life
Buildings and improvements...................... 25 - 40 years
Leaseholds and improvements ................... Shorter of primary lease term or between three to 40 years
Equipment and fixtures .............................. Two to 10 years
Properties under capital leases ................... Primary lease term or remaining primary lease term
Long-Lived Assets
On a regular (at a minimum, semi-annual) basis, the Company assesses whether events or changes in circumstances have
occurred that potentially indicate the carrying value of long-lived assets may not be recoverable. The Company tests
impairment using historical cash flows and other relevant facts and circumstances as the primary basis for estimates of future
cash flows. The Company considers factors such as the number of years a restaurant has been in operation, sales trends, cash
flow trends, remaining lease life and other factors which apply on a case-by-case basis. The analysis is performed at the
individual restaurant level for indicators of permanent impairment.
Recoverability of a restaurant's assets is measured by comparing the assets' carrying value to the undiscounted future cash
flows expected to be generated over the assets' remaining useful life or remaining lease term, whichever is less. If the total
expected undiscounted future cash flows are less than the carrying amount of the assets, this may be an indicator of