IHOP 2015 Annual Report Download - page 5
Download and view the complete annual report
Please find page 5 of the 2015 IHOP annual report below. You can navigate through the pages in the report by either clicking on the pages listed below, or by using the keyword search tool below to find specific information within the annual report.-
 1
1 -
 2
2 -
 3
3 -
 4
4 -
 5
5 -
 6
6 -
 7
7 -
 8
8 -
 9
9 -
 10
10 -
 11
11 -
 12
12 -
 13
13 -
 14
14 -
 15
15 -
 16
16 -
17
-
18
-
19
-
20
-
21
-
22
-
23
-
24
-
25
-
26
-
27
-
28
-
29
-
30
-
31
-
32
-
33
-
34
-
35
-
36
-
37
-
38
-
39
-
40
-
41
-
42
-
43
-
44
-
45
-
46
-
47
-
48
-
49
-
50
-
51
-
52
-
53
-
54
-
55
-
56
-
57
-
58
-
59
-
60
-
61
-
62
-
63
-
64
-
65
-
66
-
67
-
68
-
69
-
70
-
71
-
72
-
73
-
74
-
75
-
76
-
77
-
78
-
79
-
80
-
81
-
82
-
83
-
84
-
85
-
86
-
87
-
88
-
89
-
90
-
91
-
92
-
93
-
94
-
95
-
96
-
97
-
98
-
99
-
100
-
101
-
102
-
103
-
104
-
105
-
106
-
107
-
108
-
109
-
110
-
111
-
112
-
113
-
114
-
115
-
116
-
117
-
118
-
119
-
120
 |
 |

DINEEQUITY 2015 ANNUAL REPORT 3
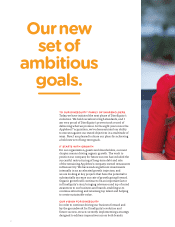
Domestically, we see ample
opportunities to increase traffic and
create deeper engagement with
guests through measures like menu
innovation, daypart expansion and
more. Internationally, we are shifting
our focus to create a bigger impact in
a few select operating markets, using
a smaller, more innovative restaurant
footprint that is tailored to the tastes
and desires of each market. We are
sharing as much knowledge between
domestic and international teams
as possible, so that each group can
benefit from the valuable insights
and experiences gained during
various phases of the process. As we
do so, we will continue to manage
our capital structure in a way that
maximizes the return of cash to
shareholders. Ultimately, we envision
DineEquity attaining the status
of a global growth company and
innovation leader in the restau-
rant space, with multiple, scalable
concepts that are best in class in
their respective categories.
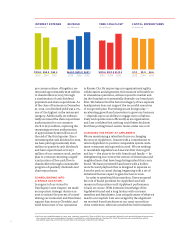
FINANCIAL PERFORMANCE
FOR 2015
DineEquity continued to build on
IHOP’s lead in the family dining
segment,¹ generating substantial
free cash flow and posting
positive comparable system-wide
same-restaurant sales at IHOP
for the 11th consecutive quarter.
We started 2015 with a mean-
ingful 17% increase in the fourth
quarter 2014 cash dividend, which
was paid on January 9th. Our
capital allocation strategy for 2015
included increasing the quarterly
dividend by 5%, bringing it to $0.92
SHAREHOLDER LETTER
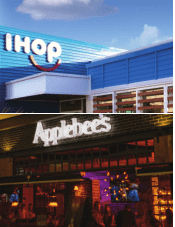
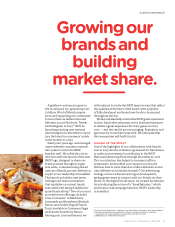
These include: generating additional organic growth by
achieving sustainable, positive sales and traffic at both
Applebee’s and IHOP® and accelerating the develop-
ment of traditional and non-traditional locations in
our domestic and international markets. We will also
continue to evaluate the viability of diversifying our
brand portfolio. These efforts, combined with other
initiatives, are being put in place to position Applebee’s
and IHOP at the forefront of consumer relevance.
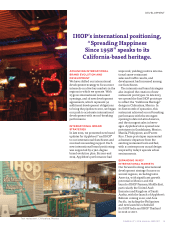
To drive organic growth, we are taking steps to broaden
the guest experience, so that we can give guests a way to
interact with the Applebee’s and IHOP brands wherever,
whenever and however they choose. This includes devel-
oping more restaurants domestically and internationally,
while also expanding the types of settings in which
our brands can be found by putting them in unique
places. We’ve made substantial progress on a number
of key initiatives, including the creation of new proto-
types, remodels and designs that will reinforce the power
of our brands, and better meet the needs of our guests.
“Our next chapter
at DineEquity is all
about generating
organic growth."
Julia Stewart
Chairman and Chief Executive Officer,
DineEquity, Inc.
Brand President, Applebee’s
1. Nation’s Restaurant News, “Top 100,” June 15, 2015. [IHOP
rank based on 2014 U.S. system-wide sales in the “family”
dining category.]