IHOP 2015 Annual Report Download - page 64
Download and view the complete annual report
Please find page 64 of the 2015 IHOP annual report below. You can navigate through the pages in the report by either clicking on the pages listed below, or by using the keyword search tool below to find specific information within the annual report.-
 1
1 -
2
-
3
-
4
-
5
-
6
-
7
-
8
-
9
-
10
-
11
-
12
-
13
-
14
-
15
-
16
-
17
-
18
-
19
-
20
-
21
-
22
-
23
-
24
-
25
-
26
-
27
-
28
-
29
-
30
-
31
-
32
-
33
-
34
-
35
-
36
-
37
-
38
-
39
-
40
-
41
-
42
-
43
-
44
-
45
-
46
-
47
-
48
-
49
-
50
-
51
-
52
-
53
-
 54
54 -
 55
55 -
 56
56 -
 57
57 -
 58
58 -
 59
59 -
 60
60 -
 61
61 -
 62
62 -
 63
63 -
 64
64 -
 65
65 -
 66
66 -
 67
67 -
 68
68 -
 69
69 -
 70
70 -
 71
71 -
 72
72 -
 73
73 -
 74
74 -
75
-
76
-
77
-
78
-
79
-
80
-
81
-
82
-
83
-
84
-
85
-
86
-
87
-
88
-
89
-
90
-
91
-
92
-
93
-
94
-
95
-
96
-
97
-
98
-
99
-
100
-
101
-
102
-
103
-
104
-
105
-
106
-
107
-
108
-
109
-
110
-
111
-
112
-
113
-
114
-
115
-
116
-
117
-
118
-
119
-
120
 |
 |

44
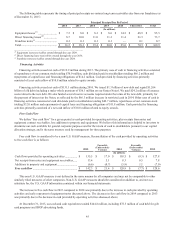
Cash Flows
Favorable
(Unfavorable)
Variance
Favorable
(Unfavorable)
Variance
2015 2014 2013
(In millions)
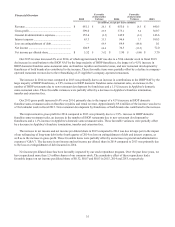
Net cash provided by operating activities................... $ 135.5 $ 17.0 $ 118.5 $ (9.3) $ 127.8
Net cash provided by investing activities................... 25.2 14.6 10.6 3.6 7.0
Net cash used in financing activities .......................... (119.9) 11.2 (131.1)(37.8)(93.3)
Net increase (decrease) in cash and cash equivalents.$ 40.8 $ 42.8 $ (2.0) $ (43.5) $ 41.5
Operating Activities
Cash provided by operating activities is primarily driven by revenues earned and collected from our franchisees, and profit
from our rental operations and financing operations. Franchise revenues primarily consist of royalties and franchise fees from
Applebee's and IHOP franchised restaurants, IHOP advertising fees and sales of proprietary products by IHOP, each of which
fluctuates with increases or decreases in franchise retail sales. Franchise retail sales are impacted by the development of IHOP
and Applebee's restaurants by our franchisees and by fluctuations in same-restaurant sales. Rental operations profit is rental
income less rental expenses. Rental income includes revenues from operating leases and interest income from direct financing
leases. Rental income is impacted by fluctuations in same-restaurant sales as some operating leases include a provision for
contingent rent based on retail sales and by a progressive decline in rental income as leases expire. Rental expenses are costs of
prime operating leases and interest expense on prime capital leases on franchisee-operated restaurants. Interest expense on
prime capital leases also declines progressively as lease obligations are repaid. Financing operations revenue consists of interest
income from the financing of franchise fees and equipment leases as well as periodic sales of restaurant equipment. Financing
income is impacted by a progressive decline in interest revenue as the obligations financed are repaid. Financing expenses are
primarily the cost of restaurant equipment.
Cash provided by operating activities increased $17.0 million in 2015 compared to 2014. Our net income plus the non-cash
reconciling items shown in our statements of cash flows (primarily loss on extinguishment of debt, depreciation, deferred taxes
and stock-based compensation) increased by $6.9 million compared to 2014. The primary reasons for the increase were lower
interest expense and an increase in gross profit, partially offset by an increase in G&A expenses and a higher effective tax rate.
Net changes in working capital provided cash of $7.8 million during 2015 compared to using cash of $2.3 million during 2014.
This favorable change of $10.1 million primarily resulted from an increase in collections of gift card receivables due to the 53rd
calendar week in fiscal 2015 partially offset by a $10.4 million reduction of interest payable.
Cash provided by operating activities decreased $9.3 million in 2014 compared to 2013. Our net income plus the non-cash
reconciling items shown in our statements of cash flows increased by $18.2 million compared to 2013. The primary reasons for
the increase were a lower effective tax rate, an increase in gross profit and lower interest costs in 2014 compared to 2013. Net
changes in working capital used cash of $2.3 million during 2014 compared to providing cash of $25.1 million during 2013.
This unfavorable change of $27.5 million was due primarily to timing of estimated tax payments resulting from tax planning
and timing of tax deductions and differences in the timing of rent payments due to varying fiscal year ends.
Investing Activities
Net cash provided by investing activities in 2015 was primarily attributable to $21.3 million of principal receipts from
notes, equipment contracts and other long-term receivables and proceeds from asset sales of $10.8 million, partially offset by
$6.6 million of capital expenditures. We expect capital expenditures to be approximately $8 million in fiscal 2016.
Net cash provided by investing activities in 2014 was primarily attributable to $15.3 million of principal receipts from
notes, equipment contracts and other long-term receivables, partially offset by $5.9 million of capital expenditures. The
increase in proceeds from asset sales in 2015 compared to 2014 was primarily due to the refranchising and sale of related
restaurant assets of 23 Applebee's company-operated restaurants discussed under “Events Impacting Comparability of Financial
Information.” We used the majority of the proceeds to repurchase shares of our stock. The increase in principal receipts was
due to the early payoff of several equipment contracts.