IHOP 2015 Annual Report Download - page 58
Download and view the complete annual report
Please find page 58 of the 2015 IHOP annual report below. You can navigate through the pages in the report by either clicking on the pages listed below, or by using the keyword search tool below to find specific information within the annual report.-
 1
1 -
2
-
3
-
4
-
5
-
6
-
7
-
8
-
9
-
10
-
11
-
12
-
13
-
14
-
15
-
16
-
17
-
18
-
19
-
20
-
21
-
22
-
23
-
24
-
25
-
26
-
27
-
28
-
29
-
30
-
31
-
32
-
33
-
34
-
35
-
36
-
37
-
38
-
39
-
40
-
41
-
42
-
43
-
44
-
45
-
46
-
47
-
 48
48 -
 49
49 -
 50
50 -
 51
51 -
 52
52 -
 53
53 -
 54
54 -
 55
55 -
 56
56 -
 57
57 -
 58
58 -
 59
59 -
 60
60 -
 61
61 -
 62
62 -
 63
63 -
 64
64 -
 65
65 -
 66
66 -
 67
67 -
 68
68 -
69
-
70
-
71
-
72
-
73
-
74
-
75
-
76
-
77
-
78
-
79
-
80
-
81
-
82
-
83
-
84
-
85
-
86
-
87
-
88
-
89
-
90
-
91
-
92
-
93
-
94
-
95
-
96
-
97
-
98
-
99
-
100
-
101
-
102
-
103
-
104
-
105
-
106
-
107
-
108
-
109
-
110
-
111
-
112
-
113
-
114
-
115
-
116
-
117
-
118
-
119
-
120
 |
 |

38
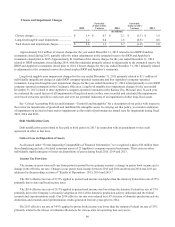
Company Operations Favorable
(Unfavorable)
Variance
Favorable
(Unfavorable)
Variance
2015 2014 2013
(In millions, except number of restaurants)
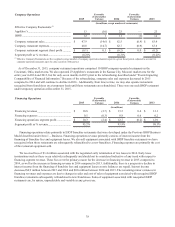
Effective Company Restaurants:(1)
Applebee’s............................................................ 13 (10) 23 — 23
IHOP..................................................................... 12 1 11 (1) 12
Company restaurant sales..................................... $ 47.9 (14.6) $ 62.5 (0.9) $ 63.4
Company restaurant expenses.............................. 48.0 (14.7) 62.7 (0.9) 63.6
Company restaurant segment (loss) profit ........... $ (0.1) 0.1 $ (0.2) 0.0 $ (0.2)
Segment profit as % revenue................................ (0.2)% (0.3)% (0.2)%
(1) Effective Company Restaurants are the weighted average number of company-operated restaurants open in a given fiscal period, adjusted to account for
company-operated restaurants open for only a portion of the period.
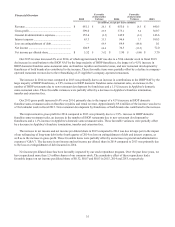
As of December 31, 2015, company restaurant operations comprised 10 IHOP company-operated restaurants in the
Cincinnati, Ohio, market area. We also operated 23 Applebee's restaurants in the Kansas City, Missouri market area for the
entire year in 2014 and 2013, but for only seven months in 2015 prior to the refranchising described under “Events Impacting
Comparability of Financial Information.” Because of the refranchising, company sales and expenses decreased in 2015
compared to 2014 and will continue to decline in 2016. Additionally, from time to time, we may also operate restaurants
reacquired from franchisees on a temporary basis until those restaurants are refranchised. There was one such IHOP restaurant
under temporary operation at December 31, 2015.
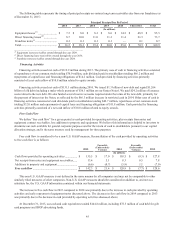
Financing Operations Favorable
(Unfavorable)
Variance
Favorable
(Unfavorable)
Variance
2015 2014 2013
(In millions)
Financing revenues............................................... $ 10.8 (2.7) $ 13.5 0.4 $ 13.1
Financing expenses .............................................. 0.5 (0.3) 0.8 0.6 0.2
Financing operations segment profit.................... $ 10.3 (2.4) $ 12.7 (0.2) $ 12.9
Segment profit as % revenue................................ 95.2% 93.9% 98.1%
Financing operations relate primarily to IHOP franchise restaurants that were developed under the Previous IHOP Business
Model described under Item 1. - Business. Financing operations revenue primarily consists of interest income from the
financing of franchise fees and equipment leases. We also sell equipment associated with IHOP franchise restaurants we have
reacquired when those restaurants are subsequently refranchised to a new franchisee. Financing expenses are primarily the cost
of the restaurant equipment sold.
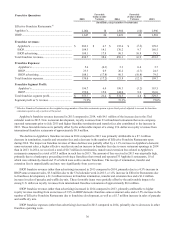
We received fees of $1.4 million associated with the negotiated early termination of two leases in 2014. Early lease
terminations such as these occur relatively infrequently and should not be considered indicative of any trend with respect to
financing segment revenue. These fees were the primary reason for the decrease in financing revenue in 2015 compared to
2014, as well as the increase in financing revenue in 2014 compared to 2013. Additionally, there is a progressive decline in
interest income from the financing of franchise fees and equipment leases as note balances are repaid. Interest income
decreased $0.9 million between 2015 and 2014 and $0.8 million between 2014 and 2013. The remaining minor variances in
financing revenues and expenses are due to changes in sales and cost of sales of equipment associated with reacquired IHOP
franchise restaurants subsequently refranchised to new franchisees. Sales of equipment associated with reacquired IHOP
restaurants are, by nature, unpredictable and variable in any given year.