IHOP 2015 Annual Report Download - page 52
Download and view the complete annual report
Please find page 52 of the 2015 IHOP annual report below. You can navigate through the pages in the report by either clicking on the pages listed below, or by using the keyword search tool below to find specific information within the annual report.-
 1
1 -
2
-
3
-
4
-
5
-
6
-
7
-
8
-
9
-
10
-
11
-
12
-
13
-
14
-
15
-
16
-
17
-
18
-
19
-
20
-
21
-
22
-
23
-
24
-
25
-
26
-
27
-
28
-
29
-
30
-
31
-
32
-
33
-
34
-
35
-
36
-
37
-
38
-
39
-
40
-
41
-
 42
42 -
 43
43 -
 44
44 -
 45
45 -
 46
46 -
 47
47 -
 48
48 -
 49
49 -
 50
50 -
 51
51 -
 52
52 -
 53
53 -
 54
54 -
 55
55 -
 56
56 -
 57
57 -
 58
58 -
 59
59 -
 60
60 -
 61
61 -
 62
62 -
63
-
64
-
65
-
66
-
67
-
68
-
69
-
70
-
71
-
72
-
73
-
74
-
75
-
76
-
77
-
78
-
79
-
80
-
81
-
82
-
83
-
84
-
85
-
86
-
87
-
88
-
89
-
90
-
91
-
92
-
93
-
94
-
95
-
96
-
97
-
98
-
99
-
100
-
101
-
102
-
103
-
104
-
105
-
106
-
107
-
108
-
109
-
110
-
111
-
112
-
113
-
114
-
115
-
116
-
117
-
118
-
119
-
120
 |
 |
32
Year Ended December 31,
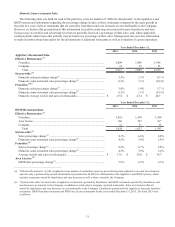
Reported sales (unaudited) 2015 2014 2013
(In millions)
Applebee's domestic franchise restaurant sales................................................................. $ 4,711.9 $ 4,535.1 $ 4,474.7
IHOP franchise restaurant sales......................................................................................... 2,948.3 2,725.7 2,553.9
IHOP area license restaurant sales..................................................................................... 280.9 265.2 249.5
Total............................................................................................................................... $ 7,941.1 $ 7,526.0 $ 7,278.1
(c) “Sales percentage change” reflects, for each category of restaurants, the percentage change in sales in any given fiscal year compared to
the prior fiscal year for all restaurants in that category. The sales percentage change for the year ended December 31, 2015 was impacted
by a 53rd calendar week in fiscal 2015.
(d) “Domestic same-restaurant sales percentage change” reflects the percentage change in sales in any given fiscal year, compared to the
same weeks in the prior year, for domestic restaurants that have been operated throughout both fiscal years that are being compared and
have been open for at least 18 months. Because of new unit openings and restaurant closures, the domestic restaurants open throughout
the fiscal years being compared may be different from year to year. Domestic same-restaurant sales percentage change does not include
data on IHOP area license restaurants.
(e) The 2015 sales percentage change for Applebee's franchise restaurants was impacted by the refranchising of 23 company-operated
restaurants during 2015. The 2013 sales percentage change for Applebee's franchise restaurants was impacted by the refranchising of
154 company-operated restaurants during 2012.
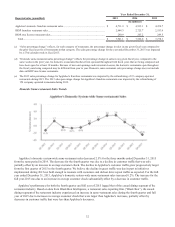
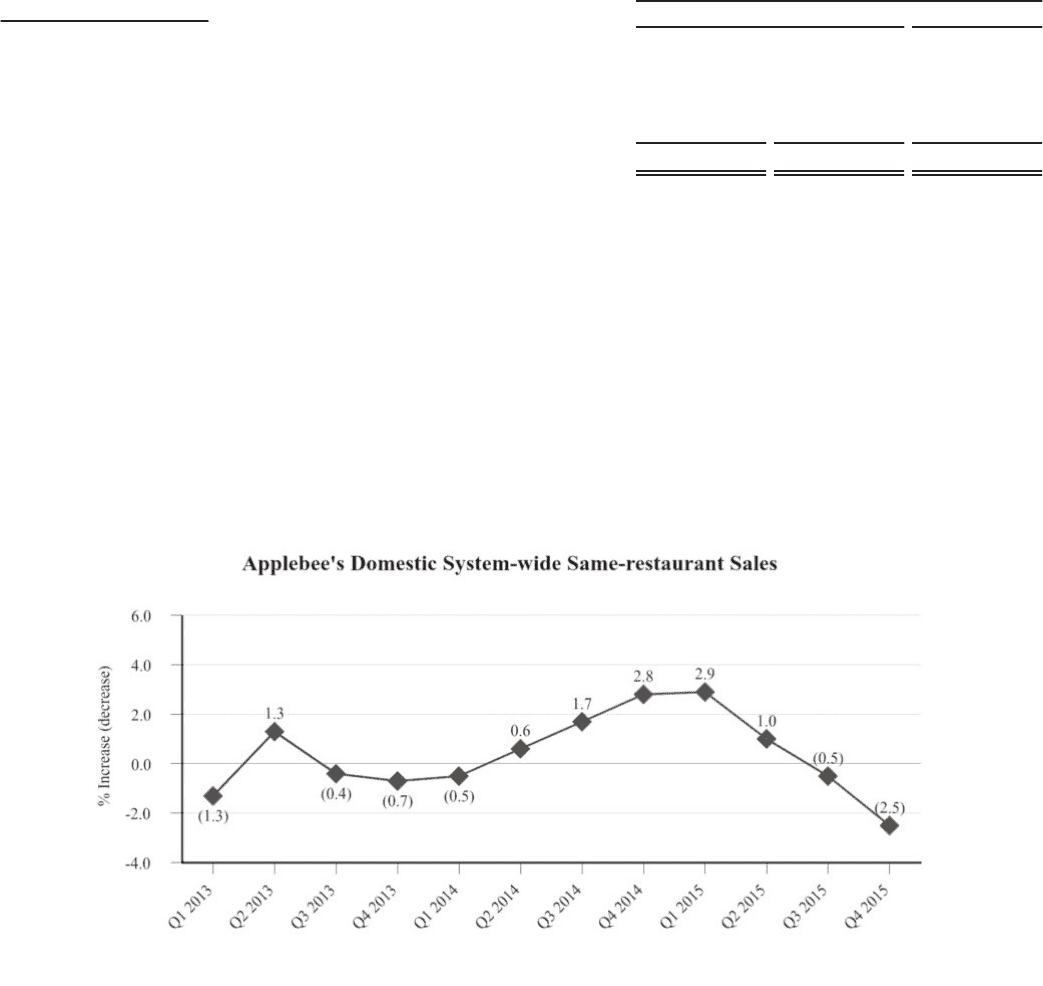
Domestic Same-restaurant Sales Trends
Applebee’s domestic system-wide same-restaurant sales decreased 2.5% for the three months ended December 31, 2015
from the same period in 2014. The decrease for the fourth quarter was due to a decline in customer traffic that was only
partially offset by an increase in average customer check. The decline in Applebee's customer traffic grew progressively larger
from the first quarter of 2015 to the fourth quarter. We believe the decline in guest traffic was due in part to initiatives
implemented during 2015 not bold enough to resonate with customers and did not drive repeat traffic as expected. For the full
year ended December 31, 2015, Applebee’s domestic system-wide same-restaurant sales increased 0.2%. The increase for the
full year 2015 was due to an increase in average customer check substantially offset by a decrease in customer traffic.
Applebee's performance for both the fourth quarter and full year of 2015 lagged that of the casual dining segment of the
restaurant industry. Based on data from Black Box Intelligence, a restaurant sales reporting firm (“Black Box”), the casual
dining segment of the restaurant industry experienced an increase in same-restaurant sales during the fourth quarter and full
year of 2015 due to increases in average customer check that were larger than Applebee's increases, partially offset by
decreases in customer traffic that were less than Applebee's decreases.