IHOP 2015 Annual Report Download - page 60
Download and view the complete annual report
Please find page 60 of the 2015 IHOP annual report below. You can navigate through the pages in the report by either clicking on the pages listed below, or by using the keyword search tool below to find specific information within the annual report.-
 1
1 -
2
-
3
-
4
-
5
-
6
-
7
-
8
-
9
-
10
-
11
-
12
-
13
-
14
-
15
-
16
-
17
-
18
-
19
-
20
-
21
-
22
-
23
-
24
-
25
-
26
-
27
-
28
-
29
-
30
-
31
-
32
-
33
-
34
-
35
-
36
-
37
-
38
-
39
-
40
-
41
-
42
-
43
-
44
-
45
-
46
-
47
-
48
-
49
-
 50
50 -
 51
51 -
 52
52 -
 53
53 -
 54
54 -
 55
55 -
 56
56 -
 57
57 -
 58
58 -
 59
59 -
 60
60 -
 61
61 -
 62
62 -
 63
63 -
 64
64 -
 65
65 -
 66
66 -
 67
67 -
 68
68 -
 69
69 -
 70
70 -
71
-
72
-
73
-
74
-
75
-
76
-
77
-
78
-
79
-
80
-
81
-
82
-
83
-
84
-
85
-
86
-
87
-
88
-
89
-
90
-
91
-
92
-
93
-
94
-
95
-
96
-
97
-
98
-
99
-
100
-
101
-
102
-
103
-
104
-
105
-
106
-
107
-
108
-
109
-
110
-
111
-
112
-
113
-
114
-
115
-
116
-
117
-
118
-
119
-
120
 |
 |

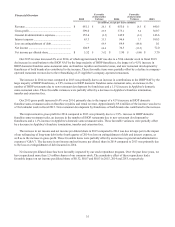
40
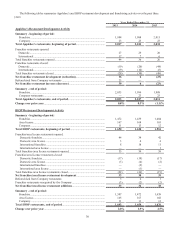
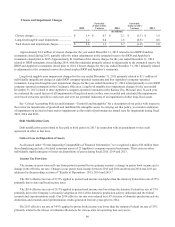
Closure and Impairment Charges
Favorable
(Unfavorable)
Variance
Favorable
(Unfavorable)
Variance
2015 2014 2013
(In millions)
Closure charges .................................................... $ 1.4 $ 0.7 $ 2.1 $ (1.1) $ 1.0
Long-lived tangible asset impairment.................. 1.2 0.4 1.6 (0.8) 0.8
Total closure and impairment charges.................. $ 2.6 1.1 3.7 (1.9) 1.8
Approximately $1.4 million of closure charges for the year ended December 31, 2015 related to two IHOP franchise
restaurants closed during 2015, partially offset by minor adjustments to the estimated reserve for IHOP and Applebee's
restaurants closed prior to 2015. Approximately $1.0 million of the closure charges for the year ended December 31, 2014
related to IHOP restaurants closed during 2014, with the remainder primarily related to adjustments to the estimated reserve for
IHOP and Applebee's restaurants closed prior to 2014. Closure charges for the year ended December 31, 2013 primarily related
to adjustments to the estimated reserve for closed surplus IHOP and Applebee's restaurants.
Long-lived tangible asset impairment charges for the year ended December 31, 2015 primarily related to $1.1 million of
individually insignificant charges at eight IHOP company-operated restaurants and four Applebee's company-operated
restaurants. Long-lived tangible asset impairment charges for the year ended December 31, 2014 related primarily to two IHOP
company-operated restaurants in the Cincinnati, Ohio area. Long-lived tangible asset impairment charges for the year ended
December 31, 2013 related to three Applebee's company-operated restaurants in the Kansas City, Missouri area. In each year,
we evaluated the causal factors of all impairments of long-lived assets as they were recorded and concluded the impairments
were based on factors specific to each asset and were not potential indicators of an impairment of other long-lived assets.
See “Critical Accounting Policies and Estimates - Goodwill and Intangibles” for a description of our policy with respect to
the review for impairments of goodwill and indefinite life intangible assets. In carrying out that policy, we noted no indicators
of impairment on an interim basis and no impairments as the result of performing our annual tests for impairment during fiscal
2015, 2014 and 2013.
Debt Modification Costs
Debt modification costs related to fees paid to third parties in 2013 in connection with an amendment to our credit
agreement in effect at that time.
Gain or Loss on Disposition of Assets
As discussed under “Events Impacting Comparability of Financial Information,” we recognized a gain of $2 million from
the refranchising and sale of related restaurant assets of 23 Applebee's company-operated restaurants. There were no other
individually significant gains or losses on dispositions of assets during fiscal 2015, 2014 and 2013.
Income Tax Provision
The income tax provision will vary from period to period for two primary reasons: a change in pretax book income and a
change in the effective tax rate. Changes in our pretax book income between 2015 and 2014 and between 2014 and 2013 are
addressed in the preceding sections of “Results of Operations - 2015, 2014 and 2013.”
The 2015 effective tax rate of 37.8% applied to pretax book income was higher than the statutory Federal tax rate of 35%
primarily due to state and local income taxes.
The 2014 effective tax rate of 29.3% applied to pretax book income was lower than the statutory Federal tax rate of 35%
primarily due to the Company’s retroactive adoption in 2014 of the domestic production activity deduction and the federal
research and experimentation credit. Our 2014 effective tax rate was reduced by 6.6% because of domestic production activity
deductions and research and experimentation credits generated from tax years prior to 2014.
The 2013 effective tax rate of 34.9% applied to pretax book income was lower than the statutory Federal tax rate of 35%
primarily related to the release of valuation allowances for various state net operating loss carryovers.