IHOP 2015 Annual Report Download - page 65
Download and view the complete annual report
Please find page 65 of the 2015 IHOP annual report below. You can navigate through the pages in the report by either clicking on the pages listed below, or by using the keyword search tool below to find specific information within the annual report.-
 1
1 -
2
-
3
-
4
-
5
-
6
-
7
-
8
-
9
-
10
-
11
-
12
-
13
-
14
-
15
-
16
-
17
-
18
-
19
-
20
-
21
-
22
-
23
-
24
-
25
-
26
-
27
-
28
-
29
-
30
-
31
-
32
-
33
-
34
-
35
-
36
-
37
-
38
-
39
-
40
-
41
-
42
-
43
-
44
-
45
-
46
-
47
-
48
-
49
-
50
-
51
-
52
-
53
-
54
-
 55
55 -
 56
56 -
 57
57 -
 58
58 -
 59
59 -
 60
60 -
 61
61 -
 62
62 -
 63
63 -
 64
64 -
 65
65 -
 66
66 -
 67
67 -
 68
68 -
 69
69 -
 70
70 -
 71
71 -
 72
72 -
 73
73 -
 74
74 -
 75
75 -
76
-
77
-
78
-
79
-
80
-
81
-
82
-
83
-
84
-
85
-
86
-
87
-
88
-
89
-
90
-
91
-
92
-
93
-
94
-
95
-
96
-
97
-
98
-
99
-
100
-
101
-
102
-
103
-
104
-
105
-
106
-
107
-
108
-
109
-
110
-
111
-
112
-
113
-
114
-
115
-
116
-
117
-
118
-
119
-
120
 |
 |

45
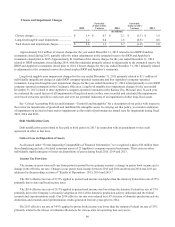
The following table represents the timing of principal receipts on various long-term receivables due from our franchisees as
of December 31, 2015:
Principal Receipts Due By Period
2016 2017 2018 2019 2020 Thereafter Total
(In millions)
Equipment leases(1) ........................ $ 7.5 $ 8.0 $ 8.3 $ 8.6 $ 14.2 $ 48.9 $ 95.5
Direct financing leases(2)................. 8.7 10.0 11.0 11.3 11.4 21.3 73.7
Franchise notes(3) .............................. 0.3 0.1 0.1 0.1 — 0.1 0.7
Total.................................................. $ 16.5 $ 18.1 $ 19.4 $ 20.0 $ 25.6 $ 70.3 $ 169.9
________________________________________________
(1) Equipment lease receivables extend through the year 2029.
(2) Direct financing lease receivables extend through the year 2036.
(3) Franchise note receivables extend through the year 2024.
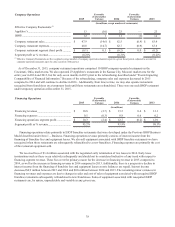
Financing Activities
Financing activities used net cash of $119.9 million during 2015. The primary uses of cash in financing activities consisted
of repurchases of our common stock totaling $70.0 million, cash dividends paid to stockholders totaling $66.2 million and
repayments of capital lease and financing obligations of $14.2 million. Cash provided by financing activities primarily
consisted of a net cash inflow of $10.8 million related to equity awards.
Financing activities used net cash of $131.1 million during 2014. We issued $1.3 billion of new debt and repaid $1.264
billion of old debt (including a make-whole premium of $36.1 million on our Senior Notes). We paid $24.2 million of issuance
costs related to the new debt. We also funded several reserve accounts required under the terms of the new debt, primarily for
the payment of interest on the Notes, as reflected by the $66.3 million increase in restricted cash in 2014. Other uses of cash in
financing activities consisted of cash dividends paid to stockholders totaling $42.7 million, repurchases of our common stock
totaling $32.0 million and repayments of capital lease and financing obligations of $11.8 million. Cash provided by financing
activities primarily consisted of a net cash inflow of $10.0 million related to equity awards.
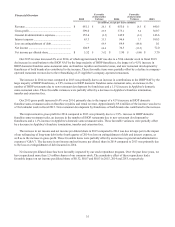
Free Cash Flow
We define “free cash flow” for a given period as cash provided by operating activities, plus receipts from notes and
equipment contract receivables, less additions to property and equipment. We believe this information is helpful to investors to
determine our cash available for general corporate purposes and for the return of cash to stockholders pursuant to our capital
allocation strategy, and is the same measure used by management for these purposes.
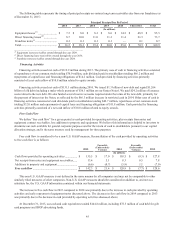
Free cash flow is considered to be a non-U.S. GAAP measure. Reconciliation of the cash provided by operating activities
to free cash flow is as follows:
Favorable
(Unfavorable)
Variance
Favorable
(Unfavorable)
Variance
2015 2014 2013
(In millions)
Cash flows provided by operating activities................. $ 135.5 $ 17.0 $ 118.5 $ (9.3) $ 127.8
Net receipts from notes and equipment receivables...... 13.4 5.1 8.3 0.5 7.8
Additions to property and equipment............................ (6.6)(0.7)(5.9) 1.1 (7.0)
Free cash flow.............................................................. $ 142.3 $ 21.4 $ 120.9 $ (7.7) $ 128.6
This non-U.S. GAAP measure is not defined in the same manner by all companies and may not be comparable to other
similarly titled measures of other companies. Non-U.S. GAAP measures should be considered in addition to, and not as a
substitute for, the U.S. GAAP information contained within our financial statements.
The increase in free cash flow in 2015 compared to 2014 was primarily due to the increase in cash provided by operating
activities and early repayment of equipment notes discussed above. The decrease in free cash flow in 2014 compared to 2013
was primarily due to the decrease in cash provided by operating activities discussed above.
At December 31, 2015, our cash and cash equivalents totaled $144.8 million, including $72.3 million of cash held for gift
card programs and IHOP advertising funds.