IHOP 2015 Annual Report Download - page 49
Download and view the complete annual report
Please find page 49 of the 2015 IHOP annual report below. You can navigate through the pages in the report by either clicking on the pages listed below, or by using the keyword search tool below to find specific information within the annual report.-
 1
1 -
2
-
3
-
4
-
5
-
6
-
7
-
8
-
9
-
10
-
11
-
12
-
13
-
14
-
15
-
16
-
17
-
18
-
19
-
20
-
21
-
22
-
23
-
24
-
25
-
26
-
27
-
28
-
29
-
30
-
31
-
32
-
33
-
34
-
35
-
36
-
37
-
38
-
 39
39 -
 40
40 -
 41
41 -
 42
42 -
 43
43 -
 44
44 -
 45
45 -
 46
46 -
 47
47 -
 48
48 -
 49
49 -
 50
50 -
 51
51 -
 52
52 -
 53
53 -
 54
54 -
 55
55 -
 56
56 -
 57
57 -
 58
58 -
 59
59 -
60
-
61
-
62
-
63
-
64
-
65
-
66
-
67
-
68
-
69
-
70
-
71
-
72
-
73
-
74
-
75
-
76
-
77
-
78
-
79
-
80
-
81
-
82
-
83
-
84
-
85
-
86
-
87
-
88
-
89
-
90
-
91
-
92
-
93
-
94
-
95
-
96
-
97
-
98
-
99
-
100
-
101
-
102
-
103
-
104
-
105
-
106
-
107
-
108
-
109
-
110
-
111
-
112
-
113
-
114
-
115
-
116
-
117
-
118
-
119
-
120
 |
 |
29
2015 Highlights
• Updated our capital allocation strategy, increasing our quarterly dividend on common stock by 5%, effective with the
fourth quarter 2015 dividend, from $0.875 per share to $0.92 per share, and increasing the stock repurchase
authorization to $150 million;
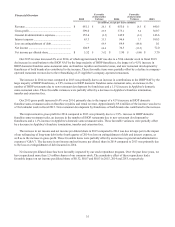
• Generated free cash flow (cash provided by operating activities, plus receipts from notes and equipment contract
receivables, less additions to property and equipment) of approximately $142 million in 2015;
• Returned over $136 million to stockholders, comprised of $70 million in the form of stock repurchases and $66
million in cash dividends;
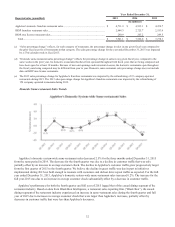
• Increased IHOP's domestic system-wide same-restaurant sales by 4.5% during 2015, the third consecutive full year of
growth in domestic system-wide same-restaurant sales and the highest yearly increase since 2004;
• Generated positive traffic growth at IHOP restaurants for the second consecutive year;
• Opened 55 new restaurants worldwide by IHOP franchisees and area licensees and 44 new restaurants by Applebee's
franchisees, the largest combined total of restaurant openings from both brands since 2009; and
• Took strategic steps to consolidate core operations, accelerate growth in our brands and speed development.
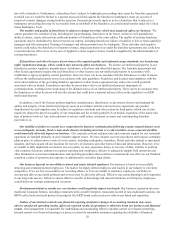
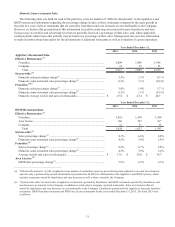
Key Performance Indicators
In evaluating the performance of each restaurant concept, we consider the key performance indicators to be net franchise
restaurant development and the percentage change in domestic system-wide same-restaurant sales. Since we are a 99%
franchised company, expanding the number of franchise restaurants is an important driver of revenue growth because we
currently do not plan to open any new Applebee's or IHOP company-operated restaurants or expand our rental and financing
operations, legacies from the Previous IHOP Business Model we operated under prior to 2003. Growth in both the number of
franchise restaurants and in sales at those restaurants will drive franchise revenues in the form of higher royalty revenues,
additional franchise fees and, in the case of IHOP restaurants, sales of proprietary pancake and waffle dry mix.
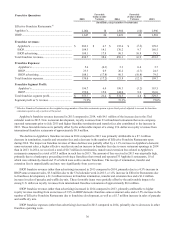
Net Franchise Restaurant Development
The number of new franchise restaurants opened by Applebee's franchisees has increased progressively over the past three
years, as has net franchise restaurant development over the same period. Applebee's net restaurant development has been
positive each of the past two years. The 44 openings in 2015 were the most Applebee's franchise restaurants opened since 2008.
We also increased the total number of franchise restaurants with the refranchising of 23 company-operated restaurants in the
Kansas City market area. As a result of that transaction, the Applebee's restaurant system is now 100% franchised.
The number of new franchise restaurants opened by IHOP franchisees and area licensees has been consistent over the past
three years, averaging 56 openings per year. Net franchise and area license restaurant development averaged 34 restaurants. The
total number of IHOP restaurants has increased approximately 2% each year for the past three years.
During 2016, we expect our franchisees to open a total of 35 to 45 new Applebee’s restaurants and a total of 60 to 70 new
IHOP restaurants, primarily in the domestic market.
The actual number of openings may differ from both our expectations and development commitments. Historically, the
actual number of restaurants developed in a particular year has been less than the total number committed to be developed due
to various factors, including economic conditions and franchisee noncompliance with development agreements. The timing of
new restaurant openings also may be affected by various factors including weather-related and other construction delays,
difficulties in obtaining timely regulatory approvals and the impact of currency fluctuations on our international franchisees.