IHOP 2015 Annual Report Download - page 59
Download and view the complete annual report
Please find page 59 of the 2015 IHOP annual report below. You can navigate through the pages in the report by either clicking on the pages listed below, or by using the keyword search tool below to find specific information within the annual report.-
 1
1 -
2
-
3
-
4
-
5
-
6
-
7
-
8
-
9
-
10
-
11
-
12
-
13
-
14
-
15
-
16
-
17
-
18
-
19
-
20
-
21
-
22
-
23
-
24
-
25
-
26
-
27
-
28
-
29
-
30
-
31
-
32
-
33
-
34
-
35
-
36
-
37
-
38
-
39
-
40
-
41
-
42
-
43
-
44
-
45
-
46
-
47
-
48
-
 49
49 -
 50
50 -
 51
51 -
 52
52 -
 53
53 -
 54
54 -
 55
55 -
 56
56 -
 57
57 -
 58
58 -
 59
59 -
 60
60 -
 61
61 -
 62
62 -
 63
63 -
 64
64 -
 65
65 -
 66
66 -
 67
67 -
 68
68 -
 69
69 -
70
-
71
-
72
-
73
-
74
-
75
-
76
-
77
-
78
-
79
-
80
-
81
-
82
-
83
-
84
-
85
-
86
-
87
-
88
-
89
-
90
-
91
-
92
-
93
-
94
-
95
-
96
-
97
-
98
-
99
-
100
-
101
-
102
-
103
-
104
-
105
-
106
-
107
-
108
-
109
-
110
-
111
-
112
-
113
-
114
-
115
-
116
-
117
-
118
-
119
-
120
 |
 |

39
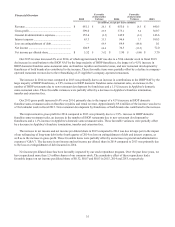
Other Income and Expense Items Favorable
(Unfavorable)
Variance
Favorable
(Unfavorable)
Variance
2015 2014 2013
(In millions)
General and administrative expenses................... $ 155.4 $ (9.5) $ 145.9 $ (2.3) $ 143.6
Interest expense.................................................... 63.3 33.3 96.6 3.7 100.3
Loss on extinguishment of debt ........................... — 64.9 64.9 (64.8) 0.1
Amortization of intangible assets......................... 10.0 2.1 12.1 0.2 12.3
Closure and impairment charges.......................... 2.6 1.1 3.7 (1.9) 1.8
Debt modification costs........................................ — — — 1.3 1.3
(Gain) loss on disposition of assets...................... (0.9) 1.2 0.3 (0.5)(0.2)
Provision for income taxes................................... 63.7 (48.6) 15.1 23.5 38.6
Effective tax rate .................................................. 37.8% (8.5)% 29.3% 5.6% 34.9%
General and Administrative Expenses
G&A expenses increased in 2015 compared to 2014, primarily due to $5.9 million of consolidation expenses described
above under “Events Impacting Comparability of Financial Information - Consolidation of Kansas City Restaurant Support
Center.” In addition, costs of professional services increased $2.3 million and certain payroll tax credits declined $1.3 million.
Salary and benefits costs increased because several executive management positions were filled in 2015, but this was offset by
the impact of a relative decrease in the per share price of our common stock on certain long-term incentive compensation
awards.
G&A expenses increased in 2014 compared to 2013, primarily due to a $1.4 million increase in compensation costs and to
charges associated with information technology infrastructure projects. These unfavorable variances were partially offset by a
decrease in costs for legal and other professional services. The increase in compensation costs was primarily due to the impact
of a relative increase in the per share price of our common stock on certain long-term incentive compensation awards.
Interest Expense
Interest expense decreased significantly in 2015 compared to 2014 due to the refinancing of debt described under “Events
Impacting Comparability of Financial Information.”
Interest expense decreased in 2014 compared to 2013 due to the debt refinancing noted above that took place at the
beginning of the fiscal fourth quarter of 2014. The decrease in 2014 interest expense due to a lower interest rate was partially
offset by approximately $6 million of interest paid during the 30-day period in which both the new long-term debt and a portion
of the old long-term debt were outstanding. See “Liquidity and Capital Resources - Refinancing of Long-Term Debt,” for
additional information.
Loss on Extinguishment of Debt
See “Events Impacting Comparability of Financial Information - Refinancing of Long-Term Debt.”
Amortization of Intangible Assets
Amortization of intangible assets relates to intangible assets arising from the November 2007 acquisition of Applebee's,
primarily franchising rights, recipes and menus. The intangible asset related to recipes and menus became fully amortized in
November 2014, resulting in the slight decline in amortization in 2014 compared to 2013 and the larger decline in amortization
in 2015 compared to 2014.