IHOP 2015 Annual Report Download - page 57
Download and view the complete annual report
Please find page 57 of the 2015 IHOP annual report below. You can navigate through the pages in the report by either clicking on the pages listed below, or by using the keyword search tool below to find specific information within the annual report.-
 1
1 -
2
-
3
-
4
-
5
-
6
-
7
-
8
-
9
-
10
-
11
-
12
-
13
-
14
-
15
-
16
-
17
-
18
-
19
-
20
-
21
-
22
-
23
-
24
-
25
-
26
-
27
-
28
-
29
-
30
-
31
-
32
-
33
-
34
-
35
-
36
-
37
-
38
-
39
-
40
-
41
-
42
-
43
-
44
-
45
-
46
-
 47
47 -
 48
48 -
 49
49 -
 50
50 -
 51
51 -
 52
52 -
 53
53 -
 54
54 -
 55
55 -
 56
56 -
 57
57 -
 58
58 -
 59
59 -
 60
60 -
 61
61 -
 62
62 -
 63
63 -
 64
64 -
 65
65 -
 66
66 -
 67
67 -
68
-
69
-
70
-
71
-
72
-
73
-
74
-
75
-
76
-
77
-
78
-
79
-
80
-
81
-
82
-
83
-
84
-
85
-
86
-
87
-
88
-
89
-
90
-
91
-
92
-
93
-
94
-
95
-
96
-
97
-
98
-
99
-
100
-
101
-
102
-
103
-
104
-
105
-
106
-
107
-
108
-
109
-
110
-
111
-
112
-
113
-
114
-
115
-
116
-
117
-
118
-
119
-
120
 |
 |

37
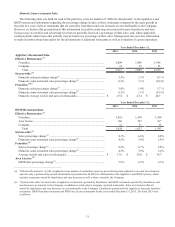
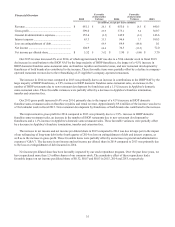
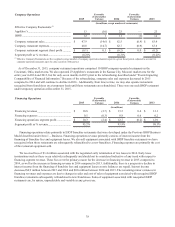
IHOP franchise expenses (other than advertising) increased in 2014 compared to 2013, primarily due to higher purchases
of pancake and waffle dry mix and increases in other franchise operating costs. These unfavorable variances were partially
offset by lower bad debt expense in 2014.
IHOP’s total franchise expenses are substantially higher than Applebee’s due to advertising expenses. Franchise fees
designated for the IHOP NAF and local marketing and advertising cooperatives are recognized as revenue and expense of
franchise operations. However, due to our having less contractual control over Applebee’s advertising expenditures, that
activity is considered to be an agency relationship and therefore is not recognized as franchise revenue and expense.
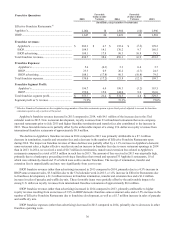
IHOP advertising revenue and expenses increased in 2015 compared to 2014, primarily due to $10.5 million of increased
contributions to the IHOP NAF by the large majority of IHOP franchisees as discussed under “Events Impacting Comparability
of Financial Information - Advertising Contributions to IHOP National Advertising Fund.” Approximately $4.8 million of the
increases were due to the increases in domestic franchise same-restaurant sales and Effective Franchise Restaurants that also
impacted IHOP franchise revenue and $2.5 million was due to the 53rd calendar week in 2015.
Approximately $5.9 million of the increases in IHOP advertising revenue and expenses in 2014 compared to 2013 were
due to the increased contributions to the IHOP NAF noted above that began in the second half of 2014. Approximately $4.9
million of the increases were due to the increases in domestic franchise same-restaurant sales and Effective Franchise
Restaurants that also impacted IHOP franchise revenue.
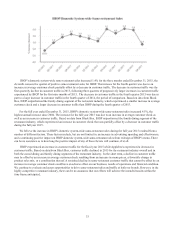
The progressive decline in franchise segment profit as a percentage of revenue over the past three years was primarily due
to the increase in IHOP advertising revenue that does not generate any segment profit.
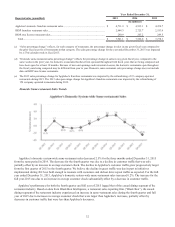
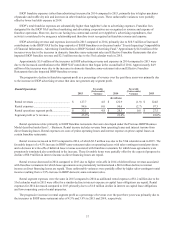
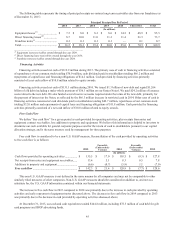
Rental Operations Favorable
(Unfavorable)
Variance
Favorable
(Unfavorable)
Variance
2015 2014 2013
(In millions)
Rental revenues .................................................. $ 127.7 4.8 $ 122.9 (1.9) $ 124.8
Rental expenses.................................................. 94.6 0.0 94.6 (2.7) 97.3
Rental operations segment profit........................ $ 33.1 4.8 $ 28.3 0.8 $ 27.5
Segment profit as % revenue.............................. 25.9% 23.0% 22.0%
Rental operations relate primarily to IHOP franchise restaurants that were developed under the Previous IHOP Business
Model described under Item 1. - Business. Rental income includes revenue from operating leases and interest income from
direct financing leases. Rental expenses are costs of prime operating leases and interest expense on prime capital leases on
certain franchise restaurants.
Rental revenue increased in 2015 compared to 2014, of which $2.5 million was due to the 53rd calendar week in 2015. The
favorable impact of a 4.5% increase in IHOP same-restaurant sales on operating leases with sales-contingent rental provisions
and a decrease in write-offs of deferred lease revenue associated with franchise restaurants for which lease agreements were
prematurely terminated also contributed to the increase. These favorable items were partially offset by the expected progressive
decline of $0.9 million in interest income as direct financing leases are repaid.
Rental revenue decreased in 2014 compared to 2013 due to higher write-offs in 2014 of deferred lease revenue associated
with franchise restaurants for which lease agreements were prematurely terminated and a $0.8 million decline in interest
income as direct financing leases are repaid. These unfavorable variances were partially offset by higher sales-contingent rental
income resulting from a 3.9% increase in IHOP domestic same-restaurant sales.
Rental segment expenses were the same in 2015 compared to 2014 as additional rental expenses of $1.2 million due to the
53rd calendar week in 2015 were offset by a similar decline in interest expense as capital lease obligations are repaid. Rental
expenses for 2014 decreased compared to 2013 primarily due to a $1.0 million decline in interest on capital lease obligations
and lower operating costs of rental properties.
The progressive increase in rental segment profit as a percentage of revenue over the past three years was primarily due to
the increases in IHOP same-restaurant sales of 4.5% and 3.9% in 2015 and 2014, respectively.