IHOP 2015 Annual Report Download - page 55
Download and view the complete annual report
Please find page 55 of the 2015 IHOP annual report below. You can navigate through the pages in the report by either clicking on the pages listed below, or by using the keyword search tool below to find specific information within the annual report.-
 1
1 -
2
-
3
-
4
-
5
-
6
-
7
-
8
-
9
-
10
-
11
-
12
-
13
-
14
-
15
-
16
-
17
-
18
-
19
-
20
-
21
-
22
-
23
-
24
-
25
-
26
-
27
-
28
-
29
-
30
-
31
-
32
-
33
-
34
-
35
-
36
-
37
-
38
-
39
-
40
-
41
-
42
-
43
-
44
-
 45
45 -
 46
46 -
 47
47 -
 48
48 -
 49
49 -
 50
50 -
 51
51 -
 52
52 -
 53
53 -
 54
54 -
 55
55 -
 56
56 -
 57
57 -
 58
58 -
 59
59 -
 60
60 -
 61
61 -
 62
62 -
 63
63 -
 64
64 -
 65
65 -
66
-
67
-
68
-
69
-
70
-
71
-
72
-
73
-
74
-
75
-
76
-
77
-
78
-
79
-
80
-
81
-
82
-
83
-
84
-
85
-
86
-
87
-
88
-
89
-
90
-
91
-
92
-
93
-
94
-
95
-
96
-
97
-
98
-
99
-
100
-
101
-
102
-
103
-
104
-
105
-
106
-
107
-
108
-
109
-
110
-
111
-
112
-
113
-
114
-
115
-
116
-
117
-
118
-
119
-
120
 |
 |

35
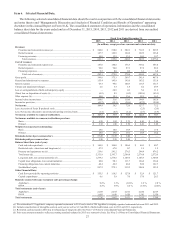
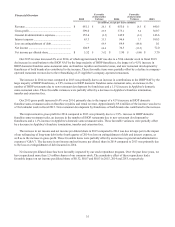
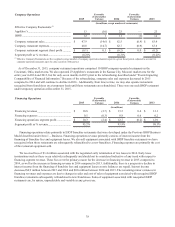
Financial Overview Favorable
(Unfavorable)
Variance
Favorable
(Unfavorable)
Variance
2015 2014 2013
(In millions, except per share amounts)
Revenue................................................................ $ 681.1 $ 26.1 $ 655.0 $ 14.5 $ 640.5
Gross profit........................................................... 399.0 23.9 375.1 5.4 369.7
General & administrative expenses...................... 155.4 (9.5) 145.9 (2.3) 143.6
Interest expense.................................................... 63.3 33.3 96.6 3.7 100.3
Loss on extinguishment of debt ........................... —64.9 64.9 (64.8) 0.1
Net income ........................................................... 104.9 68.4 36.5 (35.5) 72.0
Net income per diluted share................................ $ 5.52 $ 3.62 $ 1.90 $ (1.80) $ 3.70
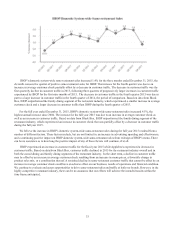
Our 2015 revenue increased 4% over 2014, of which approximately half was due to a 53rd calendar week in fiscal 2015.
An increase in contributions to the IHOP NAF by the large majority of IHOP franchisees, the impact of a 4.5% increase in
IHOP domestic franchise same-restaurant sales on franchise royalties and rental revenue, and new restaurant development by
franchisees of both brands also contributed to the increase. These favorable items were partially offset by a decline in company-
operated restaurant revenue due to the refranchising of 23 Applebee's company-operated restaurants.
The increase in 2014 revenue compared to 2013 was primarily due to an increase in contributions to the IHOP NAF by the
large majority of IHOP franchisees, a 3.9% increase in IHOP domestic franchise same-restaurant sales, an increase in the
number of IHOP restaurants due to new restaurant development by franchisees and a 1.1% increase in Applebee's domestic
same-restaurant sales. These favorable variances were partially offset by a decrease in Applebee's franchise termination,
transfer and extension fees.
Our 2015 gross profit increased 6.4% over 2014, primarily due to the impact of a 4.5% increase in IHOP domestic
franchise same-restaurant sales on franchise royalties and rental revenue. Approximately $9.4 million of the increase was due to
a 53rd calendar week in fiscal 2015. New restaurant development by franchisees of both brands also contributed to the increase.
The improvement in gross profit for 2014 compared to 2013 was primarily due to a 3.9% increase in IHOP domestic
franchise same-restaurant sales, an increase in the number of IHOP restaurants due to new restaurant development by
franchisees and a 1.1% increase in Applebee's domestic same-restaurant sales. These favorable variances were partially offset
by a decrease in Applebee's franchise termination, transfer and extension fees.
The increase in net income and net income per diluted share in 2015 compared to 2014 was due in large part to the impact
of our refinancing of long-term debt in the fourth quarter of 2014 on loss on extinguishment of debt and interest expense, as
well as to the increase in gross profit. These favorable items were partially offset by an increase in general and administrative
expenses (“G&A”). The decrease in net income and net income per diluted share in 2014 compared to 2013 was primarily due
to the loss on extinguishment of debt incurred in 2014.
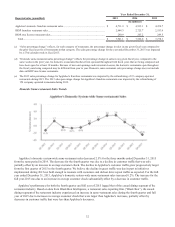
Net income per diluted share has been favorably impacted by our stock repurchase program. Over the past three years, we
have repurchased more than 1.5 million shares of our common stock. The cumulative effect of these repurchases had a
favorable impact on net income per diluted share of $0.32, $0.07 and $0.03 in 2015, 2014 and 2013, respectively.