IHOP 2015 Annual Report Download - page 56
Download and view the complete annual report
Please find page 56 of the 2015 IHOP annual report below. You can navigate through the pages in the report by either clicking on the pages listed below, or by using the keyword search tool below to find specific information within the annual report.-
 1
1 -
2
-
3
-
4
-
5
-
6
-
7
-
8
-
9
-
10
-
11
-
12
-
13
-
14
-
15
-
16
-
17
-
18
-
19
-
20
-
21
-
22
-
23
-
24
-
25
-
26
-
27
-
28
-
29
-
30
-
31
-
32
-
33
-
34
-
35
-
36
-
37
-
38
-
39
-
40
-
41
-
42
-
43
-
44
-
45
-
 46
46 -
 47
47 -
 48
48 -
 49
49 -
 50
50 -
 51
51 -
 52
52 -
 53
53 -
 54
54 -
 55
55 -
 56
56 -
 57
57 -
 58
58 -
 59
59 -
 60
60 -
 61
61 -
 62
62 -
 63
63 -
 64
64 -
 65
65 -
 66
66 -
67
-
68
-
69
-
70
-
71
-
72
-
73
-
74
-
75
-
76
-
77
-
78
-
79
-
80
-
81
-
82
-
83
-
84
-
85
-
86
-
87
-
88
-
89
-
90
-
91
-
92
-
93
-
94
-
95
-
96
-
97
-
98
-
99
-
100
-
101
-
102
-
103
-
104
-
105
-
106
-
107
-
108
-
109
-
110
-
111
-
112
-
113
-
114
-
115
-
116
-
117
-
118
-
119
-
120
 |
 |

36
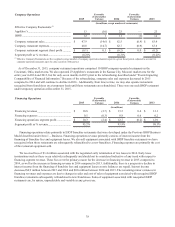
Franchise Operations Favorable
(Unfavorable)
Variance
Favorable
(Unfavorable)
Variance
2015 2014 2013
(In millions, except number of restaurants)
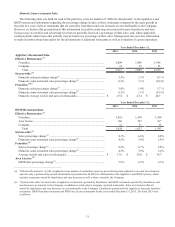
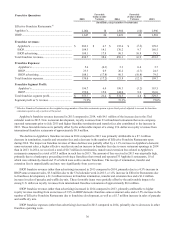
Effective Franchise Restaurants:(1)
Applebee’s............................................................. 2,004 18 1,986 (10) 1,996
IHOP...................................................................... 1,647 26 1,621 40 1,581
Franchise revenues:
Applebee's ......................................................... $ 202.3 $ 6.7 $ 195.6 $ (3.6) 199.2
IHOP.................................................................. 184.3 14.1 170.2 9.7 160.5
IHOP advertising............................................... 108.1 17.8 90.3 10.8 79.5
Total franchise revenues........................................ 494.7 38.6 456.1 16.9 439.2
Franchise Expenses:
Applebee’s........................................................ 5.6 (0.3) 5.3 0.4 5.7
IHOP................................................................. 25.3 0.9 26.2 (1.7) 24.5
IHOP advertising.............................................. 108.1 (17.8) 90.3 (10.8) 79.5
Total franchise expenses....................................... 139.0 (17.2) 121.8 (12.1) 109.7
Franchise Segment Profit:
Applebee’s........................................................ 196.7 6.4 190.3 (3.2) 193.5
IHOP................................................................. 159.0 15.0 144.0 8.0 136.0
Total franchise segment profit............................... $ 355.7 21.4 $ 334.3 4.8 $ 329.5
Segment profit as % revenue ................................ 71.9% 73.3% 75.0%
__________________________________________________________________________________________________
(1) Effective Franchise Restaurants are the weighted average number of franchise restaurants open in a given fiscal period, adjusted to account for franchise
restaurants open for only a portion of the period.
Applebee's franchise revenue increased in 2015 compared to 2014, with $4.1 million of the increase due to the 53rd
calendar week in 2015. New restaurant development, royalty revenues from 23 refranchised restaurants that were company-
operated restaurants prior to July 2015 and higher franchise termination and transfer fees also contributed to the increase in
2015. These favorable items were partially offset by the unfavorable impact of a strong U.S. dollar on royalty revenues from
international franchise restaurants of approximately $0.9 million.
The decline in Applebee’s franchise revenue in 2014 compared to 2013 was primarily attributable to a $7.1 million
decrease in termination, transfer and extension fees and a decrease in the number of Effective Franchise Restaurants open
during 2014. The impact on franchise revenue of these declines was partially offset by a 1.1% increase in Applebee's domestic
same-restaurant sales, a higher effective royalty rate and an increase in franchise fees due to more restaurant openings in 2014
than in 2013. In 2014, we received a total of $0.7 million in termination, transfer and extension fees related to Applebee's
restaurants compared to a total of $7.8 million in such fees in 2013. The amount of fees received in 2013 was atypically high,
primarily due to a bankruptcy proceeding involving a franchisee that owned and operated 33 Applebee's restaurants, 18 of
which were ultimately closed and 15 of which were sold to another franchisee. The receipt of termination, transfer and
extension fees is unpredictable and may vary significantly from year to year.
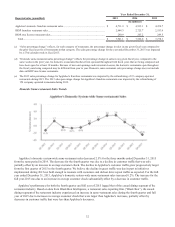
IHOP franchise revenue (other than advertising) increased in 2015 compared to 2014, primarily due to a 4.5% increase in
IHOP same-restaurant sales, $3.8 million due to the 53rd calendar week in 2015, a 1.6% increase in Effective Restaurants due
to franchisee development, a $1.3 million increase in franchise termination, transfer and extension fees and a $1.2 million
increase in sales of pancake and waffle dry mix. These favorable items were partially offset by the unfavorable impact of a
strong U.S. dollar on royalty revenues from international franchise restaurants of approximately $0.6 million.
IHOP franchise revenue (other than advertising) increased in 2014 compared to 2013, primarily attributable to higher
royalty revenue resulting from an increase of 3.9% in IHOP domestic franchise same-restaurant sales and a 2.5% increase in the
number of Effective Franchise Restaurants due to franchisee development, as well as a $1.7 million increase in sales of pancake
and waffle dry mix.
IHOP franchise expenses (other than advertising) decreased in 2015 compared to 2014, primarily due to decreases in other
franchise operating costs.