Hyundai 2008 Annual Report Download - page 7
Download and view the complete annual report
Please find page 7 of the 2008 Hyundai annual report below. You can navigate through the pages in the report by either clicking on the pages listed below, or by using the keyword search tool below to find specific information within the annual report.-
 1
1 -
 2
2 -
 3
3 -
 4
4 -
 5
5 -
 6
6 -
 7
7 -
 8
8 -
 9
9 -
 10
10 -
 11
11 -
 12
12 -
 13
13 -
 14
14 -
 15
15 -
 16
16 -
 17
17 -
 18
18 -
19
-
20
-
21
-
22
-
23
-
24
-
25
-
26
-
27
-
28
-
29
-
30
-
31
-
32
-
33
-
34
-
35
-
36
-
37
-
38
-
39
-
40
-
41
-
42
-
43
-
44
-
45
-
46
-
47
-
48
-
49
-
50
-
51
-
52
-
53
-
54
-
55
-
56
-
57
-
58
-
59
-
60
-
61
-
62
-
63
-
64
-
65
-
66
-
67
-
68
-
69
-
70
-
71
 |
 |

HYUNDAI MOTOR COMPANY I 2008 AnnuAl RepoRt I 13
>>
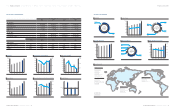
FINANCIAL HIGHLIGHTS
HYUNDAI MOTOR COMPANY I 2008 AnnuAl RepoRt I 12
IntRo I FINANCIAL HIGHLIGHTS I MessAge fRoM the Ceo I to. toMoRRow I to. Best I hyundAI wIth Me I to. doIng I hyundAI wIth honesty I suppleMent I fRoM. hyundAI
CONSOLIDATED PERFORMANCE
SEGMENT INFORMATION
2006 2007 2008 2008
For the Year :
Net Revenue 63,648,025 69,601,516 79,736,351 63,408,629
Operating Income 1,796,690 2,848,022 3,072,043 2,442,977
Net Income 1,259,247 1,600,480 857,751 682,108
ROE
6.01% 6.75% 3.38% 3.38%
At Year End :
Total Assent 70,709,485 83,847,526 103,205,783 82,072,193
Shareholder’s Equity 20,965,973 23,713,636 25,351,897 20,160,554
2004 2005 2006 2007 2008
Credit Rating :
Korea Ratings (HMC) AA AA AA AA AA
S&P BB+BBB-BBB-BBB-BBB-
Moody’s Baa3 Baa3 Baa3 Baa3 Baa3
U. S. Dollars in thousands
3,500
3,000
2,500
2,000
1,500
1,000
500
‘04 ‘05 ‘06 ‘07 ‘08
(%)
5.0%
2.5%
Won
28,000
‘04 ‘05 ‘06 ‘07 ‘08
1,600
1,200
800
400
Investment
grade
AA
BBB-Baa3
S&P Moody’s
120,000
90,000
60,000
30,000
‘04 ‘05 ‘06 ‘07 ‘08
21,000
14,000
7,000
Korean Won in millions
Won (Billion)
Won (Billion) Won (Billion)
Won (Billion) Won (Billion)
90,000
75,000
60,000
45,000
30,000
15,000
‘04 ‘05 ‘06 ‘07 ‘08
Revenues
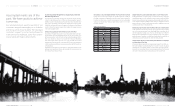
Global Network
Net Income and ROE
Credit Rating
2,400
2,000
1,600
1,200
800
400
2,800
‘04 ‘05 ‘06 ‘07 ‘08
(%)
15.0%
10.0%
5.0%
Average Sales Price
1,200
800
400
Won (Thousand)
1,600
‘04 ‘05 ‘06 ‘07 ‘08
R&D and Operating Revenue
1,500
500
Won (Billion)
2,500
2,000
1,000
‘04 ‘05 ‘06 ‘07 ‘08
(%)
5.0%
4.0%
3.0%
2.0%
1.0%
Vehicle Sales
4,000
3,000
2,000
1,000
Unit (‘000)
5,000
‘04 ‘05 ‘06 ‘07 ‘08
(HMC)
Vehicle Production
Revenues
Korea
21%
North
America
1 9 %
Europe
21%
FY 2008
4,214,770
Units
Financial
Services
6%
Automotives
94%
FY 2008
80,685
Won(Billion)
China
10.5%
India
11.6%
US
5.7%
Korea
65.2%
FY 2008
4,185,702
Units
Total Assets
Operating Income and Margin
Shareholder’s Equity and Cash Dividends Per Share
Other
Regions
39%
Other
7%
Korea
Ratings (HMC)
Hyundai Motor United Kingdom. Ltd. (HMUK)
Hyundai Motor Norway AS (HMN)
Hyundai Motor Company Italy (HMCI)
Kia Motors Sweden (KMSW)
Kia Motors UK (KMUK)
Kia Motors Belgium (KMB)
Kia Motors Ireland (KMIE)
Kia Motors France (KMF)
Kia Motors Iberia (KMIB)
Kia Motors Central Europe(Austria) (KMAS)
Kia Motors Deutschland (KMD)
Kia Motors Europe(Deutschland) (KME)
Hyundai Motor Manufacturing Rus LLC (HMMR)
Hyundai Motor CIS (HMCIS)
Hyundai Motor Poland (HMP)
Hyundai Motor Czech s.r.o. (HMCZ)
Hyundai Motor Manufacturing Czech s.r.o. (HMMC)
Hyundai Assan Otomotive Sanayi Ve Ticaret (HAOS)
Kia Motors Slovakia (KMS)
Kia Motors Russia (KMR)
Kia Motors Polska (KMP)
Hyundai Motor Group China (HMGC)
Beijing Hyundai Motor Company (BHMC)
Hyundai Motor Japan (HMJ)
Hyundai Motor India (HMI)
Hyundai Motor Company Australia (HMCA)
Dongfeng Yueda Kia (DYK)
Kia Motors Australia (KMAI)
Kia Motors New Zealand (KMNZ)
Hyundai Motor America (HMA)
Hyundai Motor Manufacturing Alabama (HMMA)
Hyundai Auto Canada (HAC)
Kia Motors America (KMA)
Kia Motors Manufacturing Georgia (KMMG)
Kia Canada Inc. (KCI)
HMC Production Plants
KMC Production Plants
HMC Sales Subsidiaries
KMC Sales Subsidiaries
W.Europe
E.Europe
Asia Pacific
North America