Hyundai 2008 Annual Report Download - page 37
Download and view the complete annual report
Please find page 37 of the 2008 Hyundai annual report below. You can navigate through the pages in the report by either clicking on the pages listed below, or by using the keyword search tool below to find specific information within the annual report.-
 1
1 -
2
-
3
-
4
-
5
-
6
-
7
-
8
-
9
-
10
-
11
-
12
-
13
-
14
-
15
-
16
-
17
-
18
-
19
-
20
-
21
-
22
-
23
-
24
-
25
-
26
-
 27
27 -
 28
28 -
 29
29 -
 30
30 -
 31
31 -
 32
32 -
 33
33 -
 34
34 -
 35
35 -
 36
36 -
 37
37 -
 38
38 -
 39
39 -
 40
40 -
 41
41 -
 42
42 -
 43
43 -
 44
44 -
 45
45 -
 46
46 -
 47
47 -
48
-
49
-
50
-
51
-
52
-
53
-
54
-
55
-
56
-
57
-
58
-
59
-
60
-
61
-
62
-
63
-
64
-
65
-
66
-
67
-
68
-
69
-
70
-
71
 |
 |
HYUNDAI MOTOR COMPANY
>>
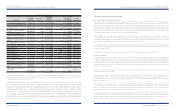
HYUNDAI MOTOR COMPANY AND SUBSIDIARIES
>>
HYUNDAI MOTOR COMPANY I 2008 AnnuAl RepoRt I HYUNDAI MOTOR COMPANY I 2008 AnnuAl RepoRt I
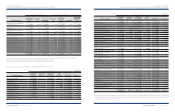
2008 2007 2008 2007
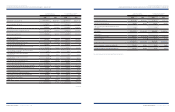
Cash flows from investing activities:
Cash outflows from investing activities:
Purchase of short-term financial instruments
₩
(3,750,711)
₩
(5,361,824) $(2,982,673) $(4,263,876)
Acquisition of short-term investment securities (1,041,087) (74,791) (827,902) (59,476)
Acquisition of long-term investment securities (288,353) (240,367) (229,307) (191,147)
Acquisition of investment securities using the equity method (91,027) (200,311) (72,387) (159,293)
Acquisition of property, plant and equipment (4,966,879) (4,381,097) (3,949,804) (3,483,974)
Expenditures for development costs (1,170,791) (983,694) (931,047) (782,262)
Additions to other current assets (69,291) (44,091) (55,102) (35,062)
Increase in other financial business assets (2,664,427) (5,475,113) (2,118,829) (4,353,967)
Additions to other assets (525,502) (564,148) (417,894) (448,626)
(14,568,068) (17,325,436) (11,584,945) (13,777,683)
(9,428,316) (10,677,030) (7,497,667) (8,490,680)
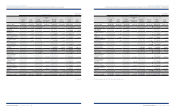
Cash flows from financing activities:
Cash inflows from financing activities:
Proceeds from short-term borrowings 20,987,053 24,645,526 16,689,505 19,598,828
Proceeds from long-term borrowings 4,694,960 3,820,629 3,733,567 3,038,274
Issuance of debentures 10,726,065 7,913,917 8,529,674 6,293,373
Proceeds from disposal of treasury stock -4,843 -3,851
Paid in capital increase 35,598 137,152 28,309 109,067
Other 416,099 363,348 330,893 288,945
36,859,775 36,885,415 29,311,948 29,332,338
Cash outflows from financing activities:
Repayment of short-term borrowings (16,504,347) (19,857,777) (13,124,729) (15,791,473)
Repayment of debentures (3,396,641) (2,859,202) (2,701,106) (2,273,719)
Payment of cash dividends (403,643) (349,782) (320,988) (278,157)
Purchase of treasury stock -(11,683) -(9,291)
Repayment of current maturities of long-term debt (4,676,815) (4,965,827) (3,719,137) (3,948,968)
Others (159,930) (108,796) (127,182) (86,517)
(25,141,376) (28,153,067) (19,993,142) (22,388,125)
11,718,399 8,732,348 9,318,806 6,944,213
350,938 88,385 279,076 70,286
Effect of change in consolidated subsidiaries 10,813 36,710 8,599 29,193
Net increase in cash and cash equivalents 1,824,526 663,685 1,450,915 527,781
Cash and cash equivalents, beginning of year 4,393,692 3,730,007 3,493,990 2,966,209
Cash and cash equivalents, end of year
₩
6,218,218
₩
4,393,692 $4,944,905 $3,493,990
See accompanying notes to consolidated financial statements.
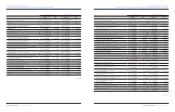
1. GENERAL INFORMATION:
The Company
Hyundai Motor Company (the “Company”) was incorporated in 1967, under the laws of the Republic of Korea, to manufacture and distribute motor vehicles and parts.
The Company owns and operates three principal automobile production bases in Korea: the Ulsan factory, the Asan factory and the Jeonju factory. In addition, the
Company has invested in five overseas manufacturing plants including Hyundai Motor Manufacturing Alabama, LLC (HMMA) as well as fifteen overseas sales and
R&D subsidiaries including Hyundai Motor America (HMA).
The shares of the Company have been listed on the Korea Exchange (formerly, Korea Stock Exchange) since 1974 and the Global Depositary Receipts issued by the
Company have been listed on the London Stock Exchange and Luxemburg Stock Exchange.
As of December 31, 2008, the major shareholders of the Company are Hyundai MOBIS (14.95%), Hyundai Steel (5.84%) and Chung, Mong Koo (5.17%).
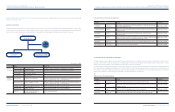
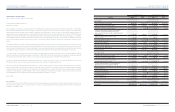
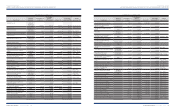
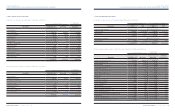
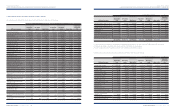
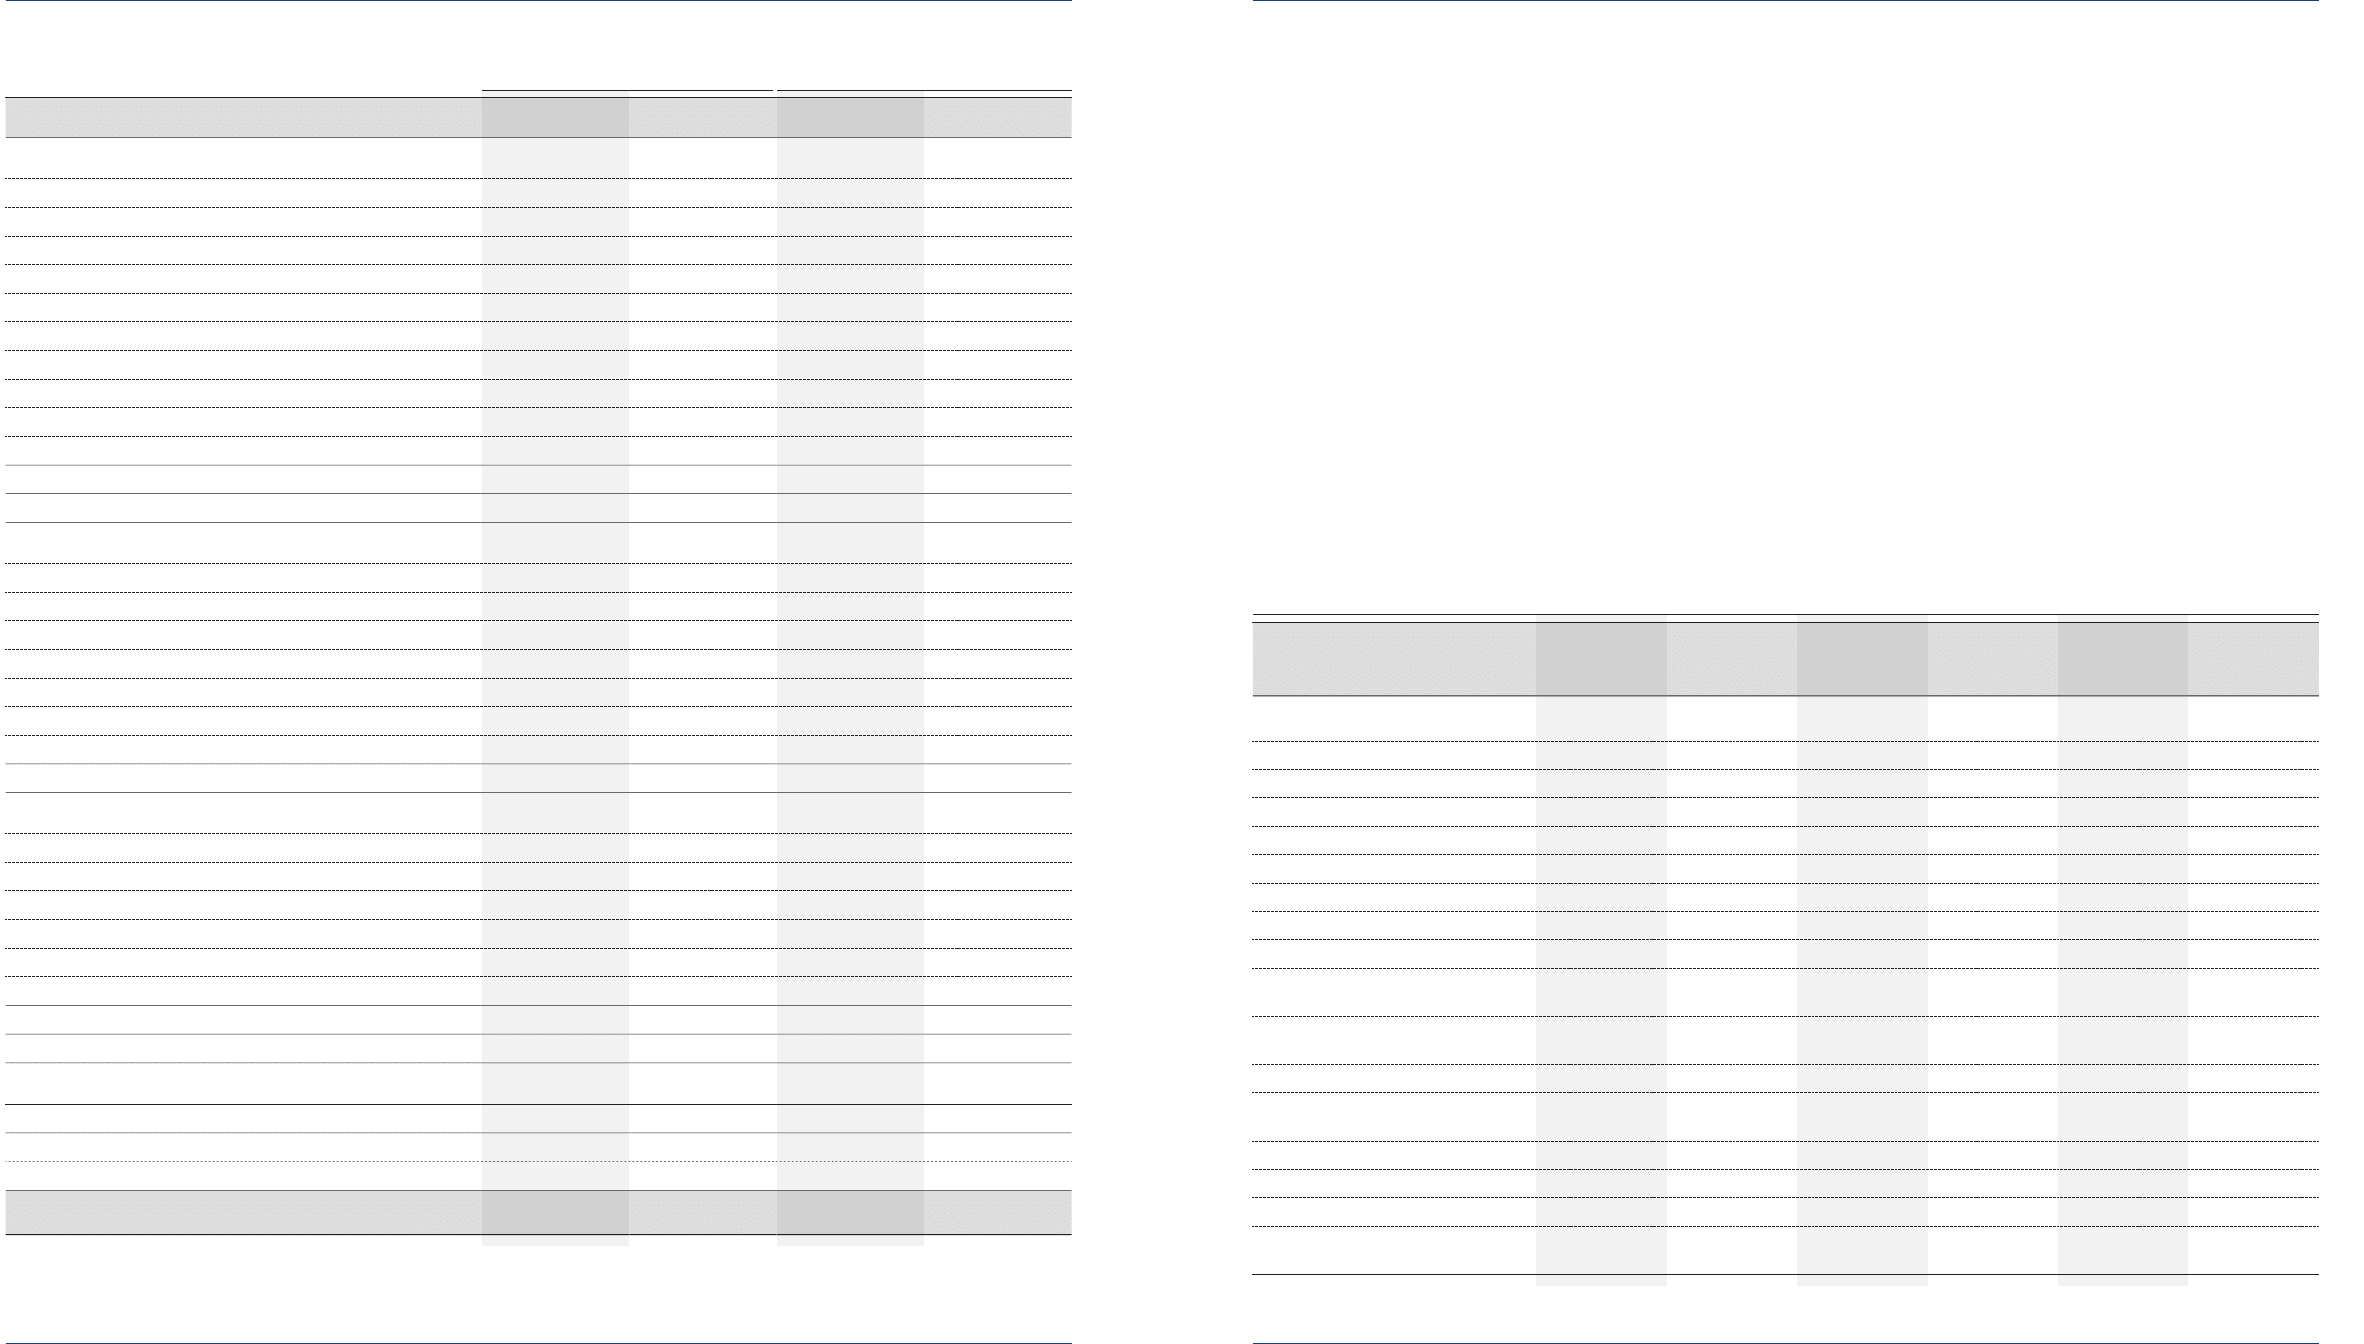
Consolidated Subsidiaries
The consolidated financial statements include the accounts of the Company and its consolidated domestic and foreign subsidiaries over which the Company has
substantial control and whose individual beginning balance of total assets or paid-in capital at the date of its establishment is more than
₩
7,000 million (US$5,567
thousand). The consolidated subsidiaries as of December 31, 2008 are as follows:
Subsidiaries
Nature of
business
Korean Won (*1)
In millions
U.S. Dollars
(Note 2)
In thousands Shares (*2)
Percentage
ownership (*2)
Indirect
ownership (*2)
DOMESTIC SUBSIDIARIES:
₩
″
″
″
″
″
″
″
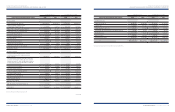
Shareholders’ equity as of December 31, 2008
Korean Won in millions U. S. Dollars (Note 2) in thousands