Hyundai 2008 Annual Report Download - page 38
Download and view the complete annual report
Please find page 38 of the 2008 Hyundai annual report below. You can navigate through the pages in the report by either clicking on the pages listed below, or by using the keyword search tool below to find specific information within the annual report.-
 1
1 -
2
-
3
-
4
-
5
-
6
-
7
-
8
-
9
-
10
-
11
-
12
-
13
-
14
-
15
-
16
-
17
-
18
-
19
-
20
-
21
-
22
-
23
-
24
-
25
-
26
-
27
-
 28
28 -
 29
29 -
 30
30 -
 31
31 -
 32
32 -
 33
33 -
 34
34 -
 35
35 -
 36
36 -
 37
37 -
 38
38 -
 39
39 -
 40
40 -
 41
41 -
 42
42 -
 43
43 -
 44
44 -
 45
45 -
 46
46 -
 47
47 -
 48
48 -
49
-
50
-
51
-
52
-
53
-
54
-
55
-
56
-
57
-
58
-
59
-
60
-
61
-
62
-
63
-
64
-
65
-
66
-
67
-
68
-
69
-
70
-
71
 |
 |
HYUNDAI MOTOR COMPANY
>>
HYUNDAI MOTOR COMPANY
>>
HYUNDAI MOTOR COMPANY I 2008 AnnuAl RepoRt I HYUNDAI MOTOR COMPANY I 2008 AnnuAl RepoRt I
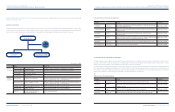
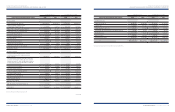
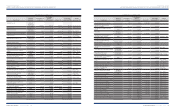
Subsidiaries
Nature of
business
Korean Won (*1)
In millions
U.S. Dollars
(Note 2)
In thousands Shares (*2)
Percentage
ownership (*2)
Indirect
ownership (*2)
M & Soft Co., Ltd. Software
consultancy
and supply
₩
31,844 $25,323 2,383,529 57.50%
Autonet : 25.67%
Mseat Co., Ltd. Manufacturing 31,697 25,206 998,140 99.81%
DYMOS :
99.81%
HMC win win fund Investment
association 30,065 23,909 4,800,000 80.00% KIA : 20.00%
Automobile Industrial Ace Corporation Manufacturing 188 150 3,116,662 100.00% WIA : 100%
Haevichi Resort
Hotel operation (17,704) (14,079) 2,015,000 65.00%
KIA : 40.00%
& WIA : 25.00%
Haevichi Country Club Co., Ltd. Golf course
operation (32,898) (26,161) 1,350,000 45.00% K I A : 1 5 %
FOREIGN SUBSIDIARIES:
Hyundai Motor America (HMA) Sales 1,595,165 1,268,521 1,150 100.00%
Hyundai Motor Manufacturing
Alabama, LLC (HMMA) Manufacturing 916,287 728,658 -100.00% HMA : 100%
Hyundai Motor Finance Company
(HMFC) Financing 707,222 562,403 750 100.00%
HMA : 89.82%
&
KMA : 10.18%
Hyundai Auto Canada Corp. (HACC) Sales 168,945 134,350 10,000,000 100.00% HMA : 100%
Stampted Metal America Research
Technology Inc. (SMARTI)
Managing
subsidiaries (14,814) (11,781) 18,542,284 72.45% HMA : 72.45%
Stampted Metal America Research
Technology LLC Manufacturing (14,814) (11,781) -100.00% SMARTI : 100%
Hyundai Translead (HT) Sales 141,429 112,468 1,160,000 100.00%
Hyundai de Mexico, S.A. de C.V.
(HYMEX) Manufacturing 14,001 11,134 9,996 99.96% HT : 99.96%
Hyundai America Technical
Center Inc. (HATCI) R & D 32,914 26,174 1,000 100.00%
World Marketing Group LLC (WMG)
Marketing 9,301 7,396 -100.00%
HMA : 50%
&
KMA : 50%
Hyundai Information Service
North America (HISNA)
Information
technology 11,329 9,009 -100.00%
HMA : 50%
& KMA : 50%
Hyundai Auto Canada Captive
Insurance Incorporation (HACCII) Insurance 5,316 4,227 100 100.00% HACC : 100%
Hyundai Motor India (HMI) Manufacturing 807,491 642,140 8,125,411 100.00%
Hyundai Motor India Engineering
Private Ltd. (HMIE) R & D 29,329 23,323 -100.00% HMI : 100%
Hyundai Assan Otomotive Sannayi
Ve Ticaret A.S. (HAOSVT)
″
(49,010) (38,974) 144,354,180,656 70.00%
Hyundai Motor Japan Co. (HMJ) Sales (11,160) (8,875) 80,000 100.00%
Hyundai Motor Europe GmbH (HME)
″
37,157 29,548 - 100.00%
Hyundai Motor Europe Technical
Center GmbH (HMETC) R & D 75,393 59,955 -100.00%
Hyundai Motor Poland Sp. Zo.O (HMP) Sales 38,560 30,664 172,862 100.00%
Hyundai Motor Norway (HMN)
″
5,958 4,738 - 100.00%
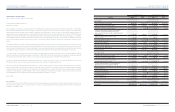
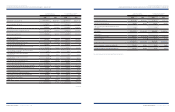
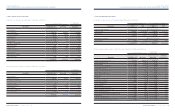
Subsidiaries
Nature of
business
Korean Won (*1)
In millions
U.S. Dollars
(Note 2)
In thousands Shares (*2)
Percentage
ownership (*2)
Indirect
ownership (*2)
Hyundai Motor (UK) Ltd. (HMUK)
″
₩
520 $414 20,000,000 100.00%
Hyundai Motor Manufacturing
Czech,s.r.o. (HMMC) Manufacturing 625,338 497,287 -100.00%
Hyundai Motor Company Australia
(HMCA) Sales 50,651 40,279 14,309,000 100.00%
HMCIS B.V Managing
subsidiaries (54,437) (43,290) 104,000,000 80.00%
Hyundai Motor Commonwealth of
Independent States (HMCIS) Sales (54,437) (43,290) -100.00%
HMCIS B.V : 100%
Hyundai Auto Czech s.r.o. (HMCZ)
″
39,827 31,672 - 100.00%
Hyundai Motor Manufacturing
Rus LLC (HMMR) Manufacturing 154,462 122,833 -100.00%
Hyundai Motor Company Italy (HMCI) Sales 29,830 23,722 - 100.00%
Hyundai Motor Group (China) Ltd.
(HMGC) Investment 90,107 71,656 -80.00% KIA : 30%
China Millennium Corporations (CMEs) Real estate
development 52,539 41,781 -89.90% KIA : 30.3%
Beijing Hines Millennium
Real Estate Development
Real estate
development 52,539 41,781 -99.00% CMEs : 99.00%
Hyundai Jingxian Motor Safeguard
Service Co. Ltd. (HJMSS) Sales 7,988 6,352 - 100.00%
Beijing Mobis Transmission Co., Ltd.
(BMT) Manufacturing 185,040 147,149 -68.04%
KIA : 24.08%
&
HMGC : 19.88%
Kia Motors Slovakia S.r.o. (KMS)
″
789,401 627,754 100 100.00% KIA : 100%
Dong Feng Yueda Kia Motor Co., Ltd.
″
522,066 415,162 -50.00% KIA : 50%
Kia Motors Manufacturing
Georgia, Inc. (KMMG)
″
366,102 291,135 -80.00%
KIA : 50%
& HMA 30%
Kia Motors Europe GmbH (KME) Managing
subsidiaries 679,862 540,646 - 100.00% KIA : 100%
Kia Motors America Inc. (KMA) Sales 136,244 108,345 1,000,000 100.00% KIA : 100%
Kia Japan Co., Ltd. (KJC)
″
32,148 25,565 267,800 100.00% KIA : 100%
Kia Motors (UK) Ltd. (KMUK)
″
62,005 49,308 17,000,000 100.00% KME : 100%
Kia Motors Sales Slovensko s.r.o. (KMSS)
″
17,868 14,209 - 100.00% KME : 100%
Kia Motors Czech s.r.o. (KMCZ)
″
15,813 12,575 106,870,000 100.00% KME : 100%
Kia Motors Sweden AB (KMSW)
″
(413) (328) 4,000,000 100.00% KME : 100%
Kia Motors Austria Gmbh (KMAS)
″
(6,480) (5,153) 2,107,512 100.00% KME : 100%
Kia Motors Hungary Kft (KMH)
″
914 727 30,000,000 100.00% KMAS : 100%
Kia Motors Iberia (KMIB)
″
(50,483) (40,146) 31,600,000 100.00% KME : 100%
Kia Motors Belgium (KMB)
″
(53,326) (42,406) 1,000,000 100.00% KME : 100%
Kia Automobiles France (KMF)
″
(125,724) (99,979) 5,000,000 100.00% KME : 100%
Kia Motors Australia Pty. Ltd. (KMAU)
″
(54,556) (43,384) - 100.00% KIA : 100%
Kia Motors New Zealand Ltd. (KMNZ)
″
(9,138) (7,267) -100.00%
KMAU : 100%
Shareholders’ equity as of December 31, 2008 Shareholders’ equity as of December 31, 2008