Hyundai 2008 Annual Report Download - page 50
Download and view the complete annual report
Please find page 50 of the 2008 Hyundai annual report below. You can navigate through the pages in the report by either clicking on the pages listed below, or by using the keyword search tool below to find specific information within the annual report.-
 1
1 -
2
-
3
-
4
-
5
-
6
-
7
-
8
-
9
-
10
-
11
-
12
-
13
-
14
-
15
-
16
-
17
-
18
-
19
-
20
-
21
-
22
-
23
-
24
-
25
-
26
-
27
-
28
-
29
-
30
-
31
-
32
-
33
-
34
-
35
-
36
-
37
-
38
-
39
-
 40
40 -
 41
41 -
 42
42 -
 43
43 -
 44
44 -
 45
45 -
 46
46 -
 47
47 -
 48
48 -
 49
49 -
 50
50 -
 51
51 -
 52
52 -
 53
53 -
 54
54 -
 55
55 -
 56
56 -
 57
57 -
 58
58 -
 59
59 -
 60
60 -
61
-
62
-
63
-
64
-
65
-
66
-
67
-
68
-
69
-
70
-
71
 |
 |

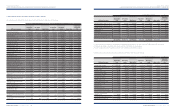
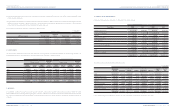
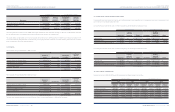
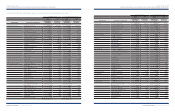
11. INTANGIBLES:
Intangibles as of December 31, 2008 and 2007 consist of the following:
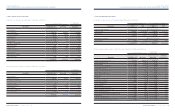
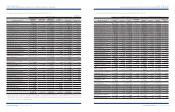
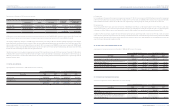
The changes in property, plant and equipment in 2007 are as follows:
(*) Other includes foreign currency adjustment, changes in the scope of consolidation, impairment loss and transfer to other assets.
As of December 31, 2008 and 2007, the value of the land, which the Company and its subsidiaries own domestically, totals
₩
5,727,078 million (US$4,554,336 thousand)
and
₩
5,395,360 million (US$4,290,545 thousand), respectively, in terms of land prices officially announced by the Korean government.
HYUNDAI MOTOR COMPANY
>>
HYUNDAI MOTOR COMPANY
>>
HYUNDAI MOTOR COMPANY I 2008 AnnuAl RepoRt I 99HYUNDAI MOTOR COMPANY I 2008 AnnuAl RepoRt I 98
Beginning
of year Acquisition Transfer
Disposal Depreciation
Other (*)
End of
year
End of
year
Land
₩
4,262,913
₩
7,782
₩
83,895
₩
(20,507)
₩
(2,696)
₩
11,801
₩
4,343,188 $3,453,827
Buildings and structures 6,380,955 302,385 638,398 (42,896) (263,790) 56,342 7,071,394 5,623,375
Machinery and equipment 8,196,382 811,701 1,407,914 (302,625) (1,155,019) 136,218 9,094,571 7,232,263
Vehicles 122,038 30,823 33,487 (27,072) (36,108) 2,972 126,140 100,310
Tools, dies and molds 1,369,674 49,276 539,150 (7,072) (432,435) (3,993) 1,514,600 1,204,453
Other equipment 653,234 120,437 106,689 (6,769) (198,912) (142,321) 532,358 423,346
Construction in progress 2,506,397 3,058,693 (2,809,533) (11,548) -203,270 2,947,279 2,343,762
₩23,491,593 ₩4,381,097 ₩ -₩(418,489) ₩
(2,088,960)
₩264,289 ₩25,629,530 $20,381,336
2008 2007 2008 2007
Description
Acquisition
cost
Accumulated
amortization
Accumulated
impairment
loss
Government
subsidy
Book value Book value Book value Book value
Goodwill
₩
699,174
₩
(184,656)
₩
-
₩
-
₩
514,518
₩
510,731 $409,159 $406,148
Negative goodwill (98,671) 30,504 - - (68,167) (73,472) (54,208) (58,427)
Industrial property rights 86,255 (64,680) (121) -21,454 27,599 17,061 21,948
Development costs 6,277,864 (3,392,260) (36,829) (49,237) 2,799,538 2,414,822 2,226,273 1,920,336
Other 331,716 (147,901) (2,301) -181,514 118,204 144,345 93,999
₩7,296,338 ₩
(3,758,993)
₩(39,251) ₩(49,237) ₩
3,448,857
₩2,997,884 $2,742,630 $2,384,003
Korean Won In millions
Korean Won In millions
U.S. Dollars (Note 2)
In thousands
U.S. Dollars (Note 2) In thousands
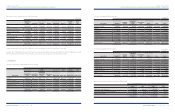
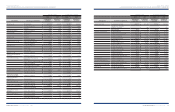
Description Goodwill
Negative
goodwill
Industrial
property
rights
Development
costs Other Total Total
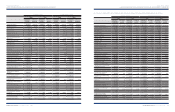
Beginning of the year
₩
510,731
₩
(73,472)
₩
27,599
₩
2,414,822
₩
118,204
₩
2,997,884 $2,384,003
Addition:
Expenditures 34,763 -11,217 1,170,791 64,184 1,280,955 1,018,652
Deduction:
Amortization (30,870) 5,270 (9,682) (776,680) (37,849) (849,811) (675,794)
Impairment loss ---(2,747) -(2,747) (2,184)
Government subsidy ---(26,633) -(26,633) (21,179)
Other (106) 35 (7,680) 19,985 36,975 49,209 39,132
End of the year
₩
514,518
₩
(68,167)
₩
21,454
₩
2,799,538
₩
181,514
₩
3,448,857 $2,742,630
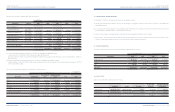
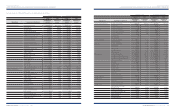
Description Goodwill
Negative
goodwill
Industrial
property
rights
Development
costs Other Total Total
₩
₩
₩
₩
₩
₩
End of the year
₩
510,731
₩
(73,472)
₩
27,599
₩
2,414,822
₩
118,204
₩
2,997,884 $2,384,003
Korean Won In millions
Korean Won In millions
U.S. Dollars (Note 2)
In thousands
U.S. Dollars (Note 2)
In thousands
The changes in intangibles in 2008 are as follows:
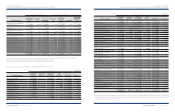
The changes in intangibles in 2007 are as follows:
Research and development expenditures in 2008 and 2007 are as follows:
2008 2007 2008 2007
Development cost (capitalized)
₩
1,170,791
₩
983,694 $931,047 $782,262
Ordinary development (manufacturing cost) 323,330 286,835 257,121 228,099
Research costs (SG&A) 696,355 608,631 553,761 484,001
₩
2,190,476
₩
1,879,160 $1,741,929 $1,494,362
Korean Won In millions U.S. Dollars (Note 2) In thousands