Hyundai 2008 Annual Report Download - page 46
Download and view the complete annual report
Please find page 46 of the 2008 Hyundai annual report below. You can navigate through the pages in the report by either clicking on the pages listed below, or by using the keyword search tool below to find specific information within the annual report.-
 1
1 -
2
-
3
-
4
-
5
-
6
-
7
-
8
-
9
-
10
-
11
-
12
-
13
-
14
-
15
-
16
-
17
-
18
-
19
-
20
-
21
-
22
-
23
-
24
-
25
-
26
-
27
-
28
-
29
-
30
-
31
-
32
-
33
-
34
-
35
-
 36
36 -
 37
37 -
 38
38 -
 39
39 -
 40
40 -
 41
41 -
 42
42 -
 43
43 -
 44
44 -
 45
45 -
 46
46 -
 47
47 -
 48
48 -
 49
49 -
 50
50 -
 51
51 -
 52
52 -
 53
53 -
 54
54 -
 55
55 -
 56
56 -
57
-
58
-
59
-
60
-
61
-
62
-
63
-
64
-
65
-
66
-
67
-
68
-
69
-
70
-
71
 |
 |
HYUNDAI MOTOR COMPANY
>>
HYUNDAI MOTOR COMPANY
>>
HYUNDAI MOTOR COMPANY I 2008 AnnuAl RepoRt I 91HYUNDAI MOTOR COMPANY I 2008 AnnuAl RepoRt I
Affiliated company
Acquisition
cost
Net equity
value Book value
Acquisition
cost
Net equity
value Book value
Ownership
percentage
(*2)
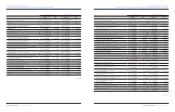
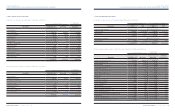
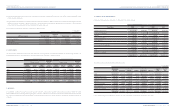
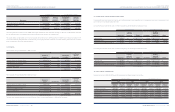
Hyundai Steel Company
₩
245,153
₩
1,061,240
₩
791,420 $194,953 $843,928 $629,360 21.39
Korea Space & Aircraft Co., Ltd. 159,800 93,646 93,452 127,078 74,470 74,316 20.54
Hyundai MOBIS 118,993 597,065 594,126 94,627 474,803 472,466 17.79
Eukor Car Carriers, Inc. 48,912 113,839 100,623 38,896 90,528 80,018 20.00
HK Mutual Savings Bank 37,114 17,071 26,391 29,514 13,575 20,987 15.49
Korea Economy Daily 34,141 29,428 32,133 27,150 23,402 25,553 24.90
Kia Tigers Co., Ltd. (*1) 20,300 31 31 16,143 25 25 100.00
Donghui Auto Co., Ltd. 10,530 9,607 9,607 8,374 7,640 7,640 35.10
Asset Management Co., Ltd. 10,067 74,236 73,161 8,006 59,035 58,180 19.99
TRW Steering Co., Ltd. 8,952 6,369 6,369 7,119 5,065 5,065 29.00
Korea Credit Bureau Co., Ltd. 3,800 2,108 3,205 3,022 1,676 2,549 7.00
Wisco Co., Ltd. 1,736 24,781 23,360 1,381 19,707 18,577 38.63
Iljin Bearing Co., Ltd. 826 16,843 16,843 657 13,394 13,394 20.00
Daesung Automotive Co., Ltd. 400 11,323 11,323 318 9,004 9,004 20.00
Seoul Sung Bo Chiup LLC -4,475 4,237 -3,559 3,369 23.30
Morningstar Korea Co., Ltd. -1,541 2,673 -1,225 2,126 39.90
Beijing-Hyundai Motor Company 379,758 840,705 825,829 301,994 668,553 656,723 50.00
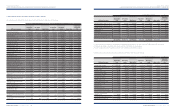
WIA Motor Dies Company (*1) 14,681 14,681 14,681 11,675 11,675 11,675 100.00
Hysco Czech S.R.O (*1) 13,162 14,227 14,329 10,467 11,314 11,395 100.00
Hyundai Motor Deutschland GmbH 6,761 23,178 22,715 5,377 18,432 18,064 30.00
Hyundai Motor Hungary (*3) 5,415 2,192 2,283 4,306 1,743 1,816 100.00
Hyundai Autonet India Private Ltd.
(HAIL) (*1) 4,308 4,802 4,308 3,426 3,819 3,426 100.00
HECT (*1) 3,972 5,277 5,277 3,159 4,196 4,196 100.00
Dymos India Automotive Private
Limited (*1) 3,722 4,873 4,873 2,960 3,875 3,875 100.00
Beijing Lear Dymos Automotive
Systems Co., Ltd. 2,662 7,138 7,195 2,117 5,676 5,721 40.00
Dymos Czech Republic s.r.o (*1) 2,553 (1,760) -2,030 (1,400) -100.00
Yan Ji Kia Motors A/S (*1) 1,792 1,792 1,792 1,425 1,425 1,425 100.00
Hyundai Motor Japan
R&D Center Inc. (*1) 1,510 3,296 3,296 1,201 2,621 2,621 100.00
Hyundai Autonet Europe (HAE)(*1) 1,005 1,237 1,005 799 984 799 100.00
Hyundai Autonet India Engineering
(HAIE)(*1) 925 1,132 925 736 900 736 100.00
Kefico Automotive Systems(Beijing)
Co. Ltd. (*1) 725 595 595 577 473 473 100.00
Korean Won In millions U.S. Dollars (Note 2) In thousands (%)
7. INVESTMENT SECURITIES ACCOUNTED FOR USING THE EQUITY METHOD:
(1) Investment securities accounted for using the equity method as of December 31, 2008 consist of the following:
Affiliated company
Acquisition
cost
Net equity
value Book value
Acquisition
cost
Net equity
value Book value
Ownership
percentage
(*2)
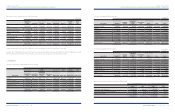
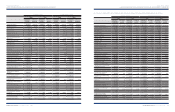
Autoever Systems China Co., Ltd. (*1)
₩
538
₩
1,026
₩
1,026 $428 $816 $816 90.00
Autoever Systems India Pvt. Ltd. (*1) 520 1,089 1,089 414 866 866 100.00
Hyundai Autonet America (HAA) (*1) 450 374 450 357 297 357 100.00
MAINTRANCE (*1) 400 573 573 317 456 456 80.00
South Link9 200 712 712 158 566 566 20.00
Rotem Equipments (Beijing) Co., Ltd. (*1)
190 338 338 150 270 268 100.00
Eukor Car Carriers Singapore Pte.(*2) 5554448.00
Hyundai Rotem Automotive (*1) 386 86 268 68 100.00
₩
1,145,981
₩
2,991,171
₩
2,702,336 $911,317 $2,378,665 $2,148,975
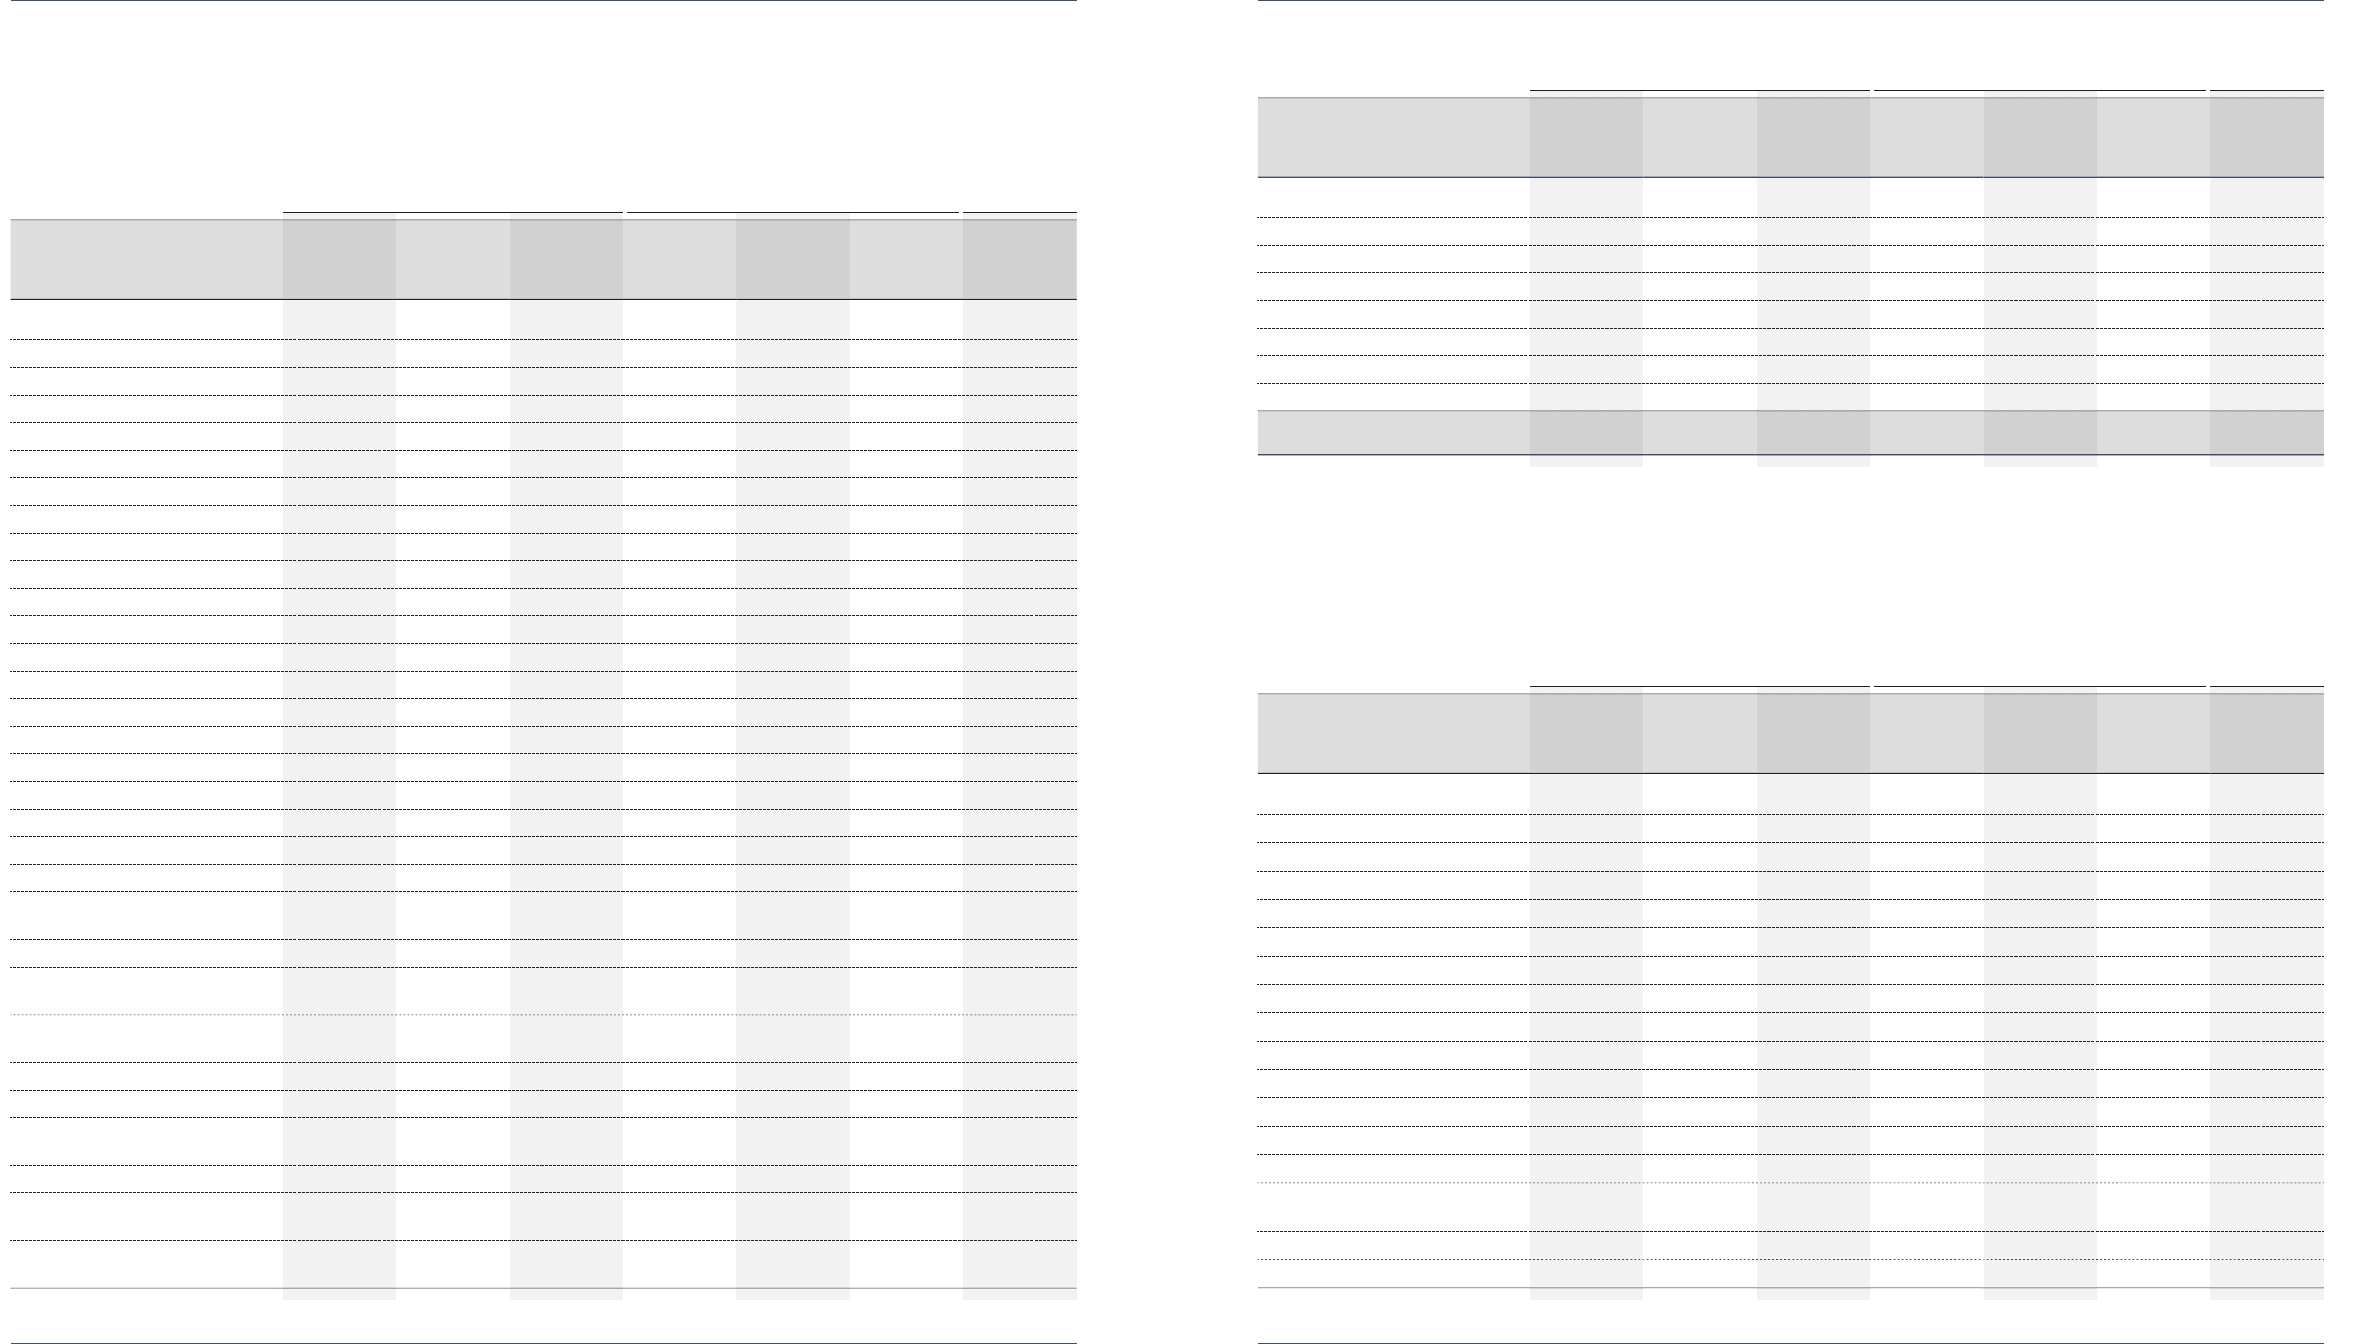
Affiliated company
Acquisition
cost
Net equity
value Book value
Acquisition
cost
Net equity
value Book value
Ownership
percentage
(*2)
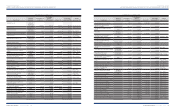
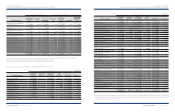
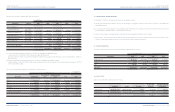
Hyundai Steel Company
₩
245,153
₩
873,814
₩
577,540 $194,953 $694,882 $459,276 21.39
Korea Space & Aircraft Co., Ltd. 159,800 89,514 89,321 127,078 71,184 71,031 20.54
Hyundai MOBIS 118,993 450,956 450,841 94,627 358,613 358,522 17.79
Eukor Car Carriers, Inc. 48,912 118,315 104,164 38,896 94,087 82,834 20.00
HK Mutual Savings Bank 45,717 37,605 29,504 36,355 29,905 23,462 18.64
Korea Economy Daily 34,141 28,867 31,854 27,150 22,956 25,331 24.90
Kia Tigers Co., Ltd. (*1) 20,300 (437) -16,143 (348) -100.00
Donghui Auto Co., Ltd. 10,530 8,572 9,303 8,374 6,817 7,398 35.10
Asset Management Co., Ltd. 10,067 59,262 57,111 8,006 47,127 45,416 19.99
TRW Steering Co., Ltd. 8,952 4,797 4,797 7,119 3,815 3,815 29.00
Wisco Co., Ltd. 1,736 8,285 6,782 1,381 6,588 5,393 38.63
Iljin Bearing Co., Ltd. 826 16,109 16,109 657 12,810 12,810 20.00
Daesung Automotive Co., Ltd. 400 10,714 10,714 318 8,520 8,520 20.00
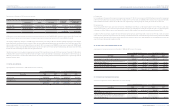
Beijing-Hyundai Motor Company 339,395 522,667 516,196 269,897 415,640 410,494 50.00
Kia Motors Manufacturing
Georgia Inc. (*1)
75,056 73,964 74,425 59,687 58,818 59,185 80.00
Hyundai Motor Deutschland GmbH 6,761 18,402 17,908 5,377 14,634 14,241 30.00
Hyundai Motor Hungary (*3) 5,415 2,192 2,283 4,306 1,743 1,816 100.00
Korean Won In millions
Korean Won In millions
U.S. Dollars (Note 2) In thousands
U.S. Dollars (Note 2) In thousands
(%)
(%)
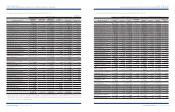
(*1) These companies are excluded in the consolidation since individual beginning balance of total assets is less than
₩
7,000 million (US$5,567 thousand).
(*2) Ownership percentage is calculated by combining the ownership of the Company and its subsidiaries.
(*3) As the company was under the liquidation procedure, it was excluded from consolidated subsidiaries.
Investment securities accounted for using the equity method as of December 31, 2007 consist of the following: