Hyundai 2008 Annual Report Download - page 65
Download and view the complete annual report
Please find page 65 of the 2008 Hyundai annual report below. You can navigate through the pages in the report by either clicking on the pages listed below, or by using the keyword search tool below to find specific information within the annual report.-
 1
1 -
2
-
3
-
4
-
5
-
6
-
7
-
8
-
9
-
10
-
11
-
12
-
13
-
14
-
15
-
16
-
17
-
18
-
19
-
20
-
21
-
22
-
23
-
24
-
25
-
26
-
27
-
28
-
29
-
30
-
31
-
32
-
33
-
34
-
35
-
36
-
37
-
38
-
39
-
40
-
41
-
42
-
43
-
44
-
45
-
46
-
47
-
48
-
49
-
50
-
51
-
52
-
53
-
54
-
 55
55 -
 56
56 -
 57
57 -
 58
58 -
 59
59 -
 60
60 -
 61
61 -
 62
62 -
 63
63 -
 64
64 -
 65
65 -
 66
66 -
 67
67 -
 68
68 -
 69
69 -
 70
70 -
 71
71
 |
 |

HYUNDAI MOTOR COMPANY
>>
HYUNDAI MOTOR COMPANY
>>
HYUNDAI MOTOR COMPANY I 2008 AnnuAl RepoRt I HYUNDAI MOTOR COMPANY I 2008 AnnuAl RepoRt I
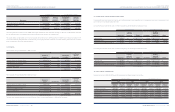
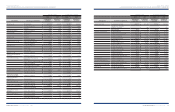
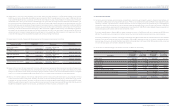
(1) Consolidated financial statements by industry
The consolidated balance sheets as of December 31, 2008 and 2007, and consolidated statements of income for the years then ended, by industry under which the
Company and its subsidiaries’ business are classified, are as follows:
Consolidated Balance Sheets as of December 31, 2008
ASSETS
Non-financial
industry
Financial
industry
Non-financial
industry
Financial
industry
Current assets:
₩
36,597,380
₩
3,064,734 $29,103,285 $2,437,164
Non-current assets:
Investments, net of unamortized present value discount 7,723,038 2,298,059 6,141,580 1,827,482
Property, plant and equipment, net of accumulated depreciation 28,537,628 380,632 22,693,939 302,690
Intangibles, net of amortization 3,340,385 57,032 2,656,370 45,353
Other financial business assets -24,664,484 -19,613,904
Total non-current assets 39,601,051 27,400,207 31,491,889 21,789,429
Total assets
₩
76,198,431
₩
30,464,941 $60,595,174 $24,226,593
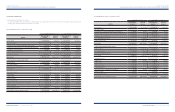
LIABILITIES AND SHAREHOLDERS’ EQUITY
Current liabilities
₩
37,629,100
₩
11,438,078 $29,923,738 $9,095,887
Non-current liabilities 14,905,860 14,300,673 11,853,566 11,372,305
Other financial business liabilities -783,035 -622,691
Total liabilities 52,534,960 26,521,786 41,777,304 21,090,883
Shareholders’ equity:
Capital stock 1,488,993 2,107,945 1,184,090 1,676,298
Capital surplus 5,467,261 566,233 4,347,722 450,285
Retained earnings 11,885,854 1,277,969 9,451,971 1,016,278
Capital adjustments (719,874) 20,735 (572,464) 16,489
Accumulated other comprehensive income(loss) 868,277 (29,727) 690,479 (23,640)
Minority interests 4,672,960 -3,716,072 -
Total shareholders’ equity 23,663,471 3,943,155 18,817,870 3,135,710
Total liabilities and shareholders’ equity
₩
76,198,431
₩
30,464,941 $60,595,174 $24,226,593
Korean Won In millions U.S. Dollars (Note 2) In thousands
Korean Won In millions U.S. Dollars (Note 2) In thousands
Consolidated Balance Sheets as of December 31, 2007
ASSETS
Non-financial
industry
Financial
industry
Non-financial
industry
Financial
industry
₩
₩
Total assets
₩
61,972,185
₩
24,138,481 $49,282,056 $19,195,611
LIABILITIES AND SHAREHOLDERS’ EQUITY
₩
₩
Total liabilities and shareholders’ equity
₩
61,972,185
₩
24,138,481 $49,282,056 $19,195,611