Hyundai 2008 Annual Report Download - page 66
Download and view the complete annual report
Please find page 66 of the 2008 Hyundai annual report below. You can navigate through the pages in the report by either clicking on the pages listed below, or by using the keyword search tool below to find specific information within the annual report.-
 1
1 -
2
-
3
-
4
-
5
-
6
-
7
-
8
-
9
-
10
-
11
-
12
-
13
-
14
-
15
-
16
-
17
-
18
-
19
-
20
-
21
-
22
-
23
-
24
-
25
-
26
-
27
-
28
-
29
-
30
-
31
-
32
-
33
-
34
-
35
-
36
-
37
-
38
-
39
-
40
-
41
-
42
-
43
-
44
-
45
-
46
-
47
-
48
-
49
-
50
-
51
-
52
-
53
-
54
-
55
-
 56
56 -
 57
57 -
 58
58 -
 59
59 -
 60
60 -
 61
61 -
 62
62 -
 63
63 -
 64
64 -
 65
65 -
 66
66 -
 67
67 -
 68
68 -
 69
69 -
 70
70 -
 71
71
 |
 |

Korean Won In millions
Korean Won In millions
U.S. Dollars (Note 2) In thousands
U.S. Dollars (Note 2) In thousands
HYUNDAI MOTOR COMPANY
>>
HYUNDAI MOTOR COMPANY
>>
HYUNDAI MOTOR COMPANY I 2008 AnnuAl RepoRt I 131HYUNDAI MOTOR COMPANY I 2008 AnnuAl RepoRt I
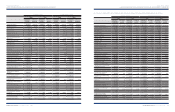
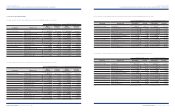
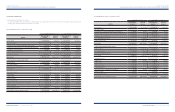
Consolidated Statements of Income for the year ended December 31, 2008
Consolidated Statements of Income for the year ended December 31, 2007
Non-financial
industry
Financial
industry
Non-financial
industry
Financial
industry
Sales
₩
76,192,054
₩
4,492,889 $60,590,103 $3,572,874
Cost of sales 60,179,804 2,597,430 47,856,703 2,065,551
Selling and administrative expenses 13,584,731 1,314,976 10,802,967 1,045,707
Operating income 2,427,519 580,483 1,930,433 461,617
Other income (expenses), net (1,360,568) 143,867 (1,081,963) 114,407
Income before income tax 1,066,961 724,350 848,470 576,024
Income tax expense 222,440 187,478 176,891 149,088
Net income
₩
844,511
₩
536,872 $671,579 $426,936
Attributable to:
Equity holders of the parent
₩
879,699
₩
536,872 $699,562 $426,936
Minority interests (35,188) -(27,983) -
₩
844,511
₩
536,872 $671,579 $426,936
Non-financial
industry
Financial
industry
Non-financial
industry
Financial
industry
₩
₩
Net income
₩
1,622,640
₩
574,987 $1,290,370 $457,246
₩
₩
₩
1,622,640
₩
574,987 $1,290,370 $457,246
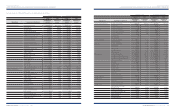
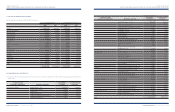
The above consolidated financial statements by industry type are prepared independently between non-financial industry and financial industry. Therefore, the total
amounts, such as assets and net income for each industry, do not tally with the corresponding amounts in the consolidated balance sheets and statements of income.
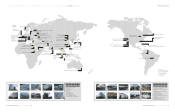
Korean Won In millions
Korean Won In millions
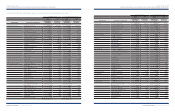
Domestic
North
America Asia Europe
Consolidation
adjustments
Consolidated
amounts
Total sales
₩
67,925,912
₩
20,736,976
₩
11,109,982
₩
17,288,701
₩
(37,325,220)
₩
79,736,351
Inter-company sales (25,432,889) (4,651,446) (824,792) (6,416,093) 37,325,220 -
Net sales 42,493,023 16,085,530 10,285,190 10,872,608 -79,736,351
Operating income 3,474,314 (138,195) 278,054 (270,633) (271,497) 3,072,043
Total assets 82,782,195 22,765,447 7,858,805 13,083,435 (23,196,949) 103,292,933
Domestic
North
America Asia Europe
Consolidation
adjustments
Consolidated
amounts
₩
₩
₩
₩
₩
₩
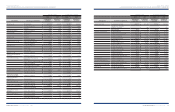
Total assets 72,455,687 15,008,890 4,234,227 10,293,461 (18,285,927) 83,706,338
(2)RegionalResultsofOperationsandTotalAssets
Resultsofoperationsandtotalassets,byregionwheretheCompanyanditssubsidiariesfortheyearendedandasofDecember31,2008arelocated,areasfollows:
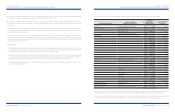
Hyundai Capital Service Inc. sold receivables to the SPCs for the purpose of raising its operating capital in accordance with the Act on Asset Backed Securities. The
amounts of disposal for the years ended December 31, 2008 and 2007 are
₩
1,881,851 million (US$1,496,502 thousand) and
₩
619,474 million (US$ 492,623 thousand),
respectively. The amounts of money receivable trust purchased at the disposal of receivables to the SPCs are
₩
614,331 million (US$488,534 thousand) and
₩
248,754
million (US$197,816 thousand) in 2008 and 2007, respectively. Also, Hyundai Card Co., Ltd. sold its card assets of
₩
806,608 million (US$ 641,438 thousand) for
₩
806,608 million (US$ 641,438 thousand) and
₩
728,060 million (US$ 578,974 thousand) for
₩
724,868 million (US$ 576,436 thousand) in 2008 and 2007, respectively, in
accordance with the Act on Asset Backed Securities. The target loan principal of the related assets is
₩
1,629,994 million (US$ 1,296,218 thousand) as of December 31,
2008. The principle of the trust assets varies according to the amount used by the credit card members as they are comprehensive transferred assets of the member.
It recognized assets in trust as net of asset-backed senior series beneficial trust certificates amounting to
₩
727,700 million (US$ 578,688 thousand) and
₩
400,300
million (US$ 318,330 thousand) as of December 31, 2008 and 2007, respectively.
In addition, Hyundai Card Co., Ltd. sold its accounts written-off and overdue card assets of
₩
110,236 million (US$87,663 thousand) and
₩
135,890 million (US$ 108,064
thousand) to Hyundai Capital Service Inc. in 2008 and 2007, respectively. It recognizes the difference between book value and sales value as bad debt provisions.
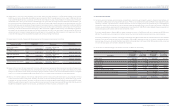
Results of operations and total assets, by region where the Company and its subsidiaries for the year ended and as of December 31, 2007 are located, are as follows: