Hyundai 2008 Annual Report Download - page 49
Download and view the complete annual report
Please find page 49 of the 2008 Hyundai annual report below. You can navigate through the pages in the report by either clicking on the pages listed below, or by using the keyword search tool below to find specific information within the annual report.-
 1
1 -
2
-
3
-
4
-
5
-
6
-
7
-
8
-
9
-
10
-
11
-
12
-
13
-
14
-
15
-
16
-
17
-
18
-
19
-
20
-
21
-
22
-
23
-
24
-
25
-
26
-
27
-
28
-
29
-
30
-
31
-
32
-
33
-
34
-
35
-
36
-
37
-
38
-
 39
39 -
 40
40 -
 41
41 -
 42
42 -
 43
43 -
 44
44 -
 45
45 -
 46
46 -
 47
47 -
 48
48 -
 49
49 -
 50
50 -
 51
51 -
 52
52 -
 53
53 -
 54
54 -
 55
55 -
 56
56 -
 57
57 -
 58
58 -
 59
59 -
60
-
61
-
62
-
63
-
64
-
65
-
66
-
67
-
68
-
69
-
70
-
71
 |
 |
HYUNDAI MOTOR COMPANY
>>
HYUNDAI MOTOR COMPANY
>>
HYUNDAI MOTOR COMPANY I 2008 AnnuAl RepoRt I HYUNDAI MOTOR COMPANY I 2008 AnnuAl RepoRt I 96
(4) Significant unrealized profits (losses) that occurred in transactions with investees in 2008 and 2007 are
₩
21,634 million ($17,204 thousand) and
₩
18,565 million
($14,763 thousand), respectively.
(5) Unamortized (or unreversed) balances of goodwill and negative goodwill as of December 31, 2008 are
₩
15,778 million (US$12,547 thousand) and
₩
284,739 million
(US$226,433 thousand), respectively. In addition, unamortized (or unreversed) balances of goodwill and negative goodwill as of December 31, 2007 are
₩
18,558
million (US$14,758 thousand) and
₩
313,207 million (US$249,071 thousand), respectively.
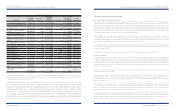
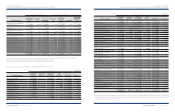
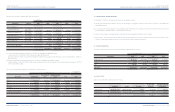
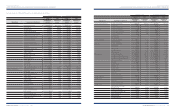
(6) The market price of listed equity securities as of December 31, 2008 is as follows:
Affiliated company Price per share
Number of
shares Market value Market value
Hyundai Steel Company
₩
37,600 18,159,517
₩
682,787 $542,972
Hyundai MOBIS 63,100 15,558,120 981,717 780,689
HK Mutual Savings Bank 28,287 3,864,398 109,312 86,928
Korean Won In millions
U.S. Dollars (Note 2)
In thousands
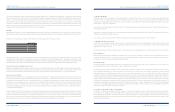
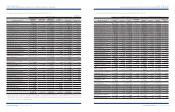
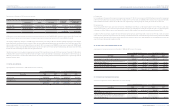
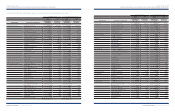
8. LEASED ASSETS:
The Company and its subsidiaries have entered into lease agreements for certain machinery. The capital lease obligations are included in long-term debt in the
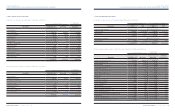
accompanying balance sheets. Annual payments on these lease agreements as of December 31, 2008 are as follows:
9. INSURANCE:
As of December 31, 2008, certain property, plant and equipment, inventories, cash and cash equivalents and securities are insured for
₩
20,337,397 million
(US$16,172,880 thousand) with Hyundai Fire & Marine Insurance Co. and others. In addition, the Company carries products and completed operations liability insurance
with a maximum coverage of
₩
314,847 million (US$250,375 thousand) and general insurance for vehicles and workers’ compensation and casualty insurance for
employees.
Finance leases Operating
leases Finance leases Operating
leases
Lease
payments
Interest
portion
Lease
obligation
Lease
payments
Lease
payments
Interest
portion
Lease
obligation
Lease
payments
2009
₩
96,968
₩
2,471
₩
94,497
₩
572,528 $77,112 $1,965 $75,147 $455,291
2010 16,672 2,397 14,275 335,924 13,258 1,906 11,352 267,136
2011 16,672 2,397 14,275 339,912 13,258 1,906 11,352 270,308
2012 16,672 2,397 14,275 303,178 13,258 1,906 11,352 241,096
Thereafter 33,342 2,397 30,945 340,292 26,514 1,906 24,608 270,610
₩
180,326
₩
12,059
₩
168,267
₩
1,891,834
$143,400 $9,589 $133,811 $1,504,441
Korean Won In millions U.S. Dollars (Note 2) In thousands
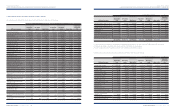
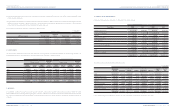
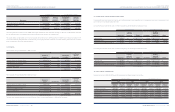
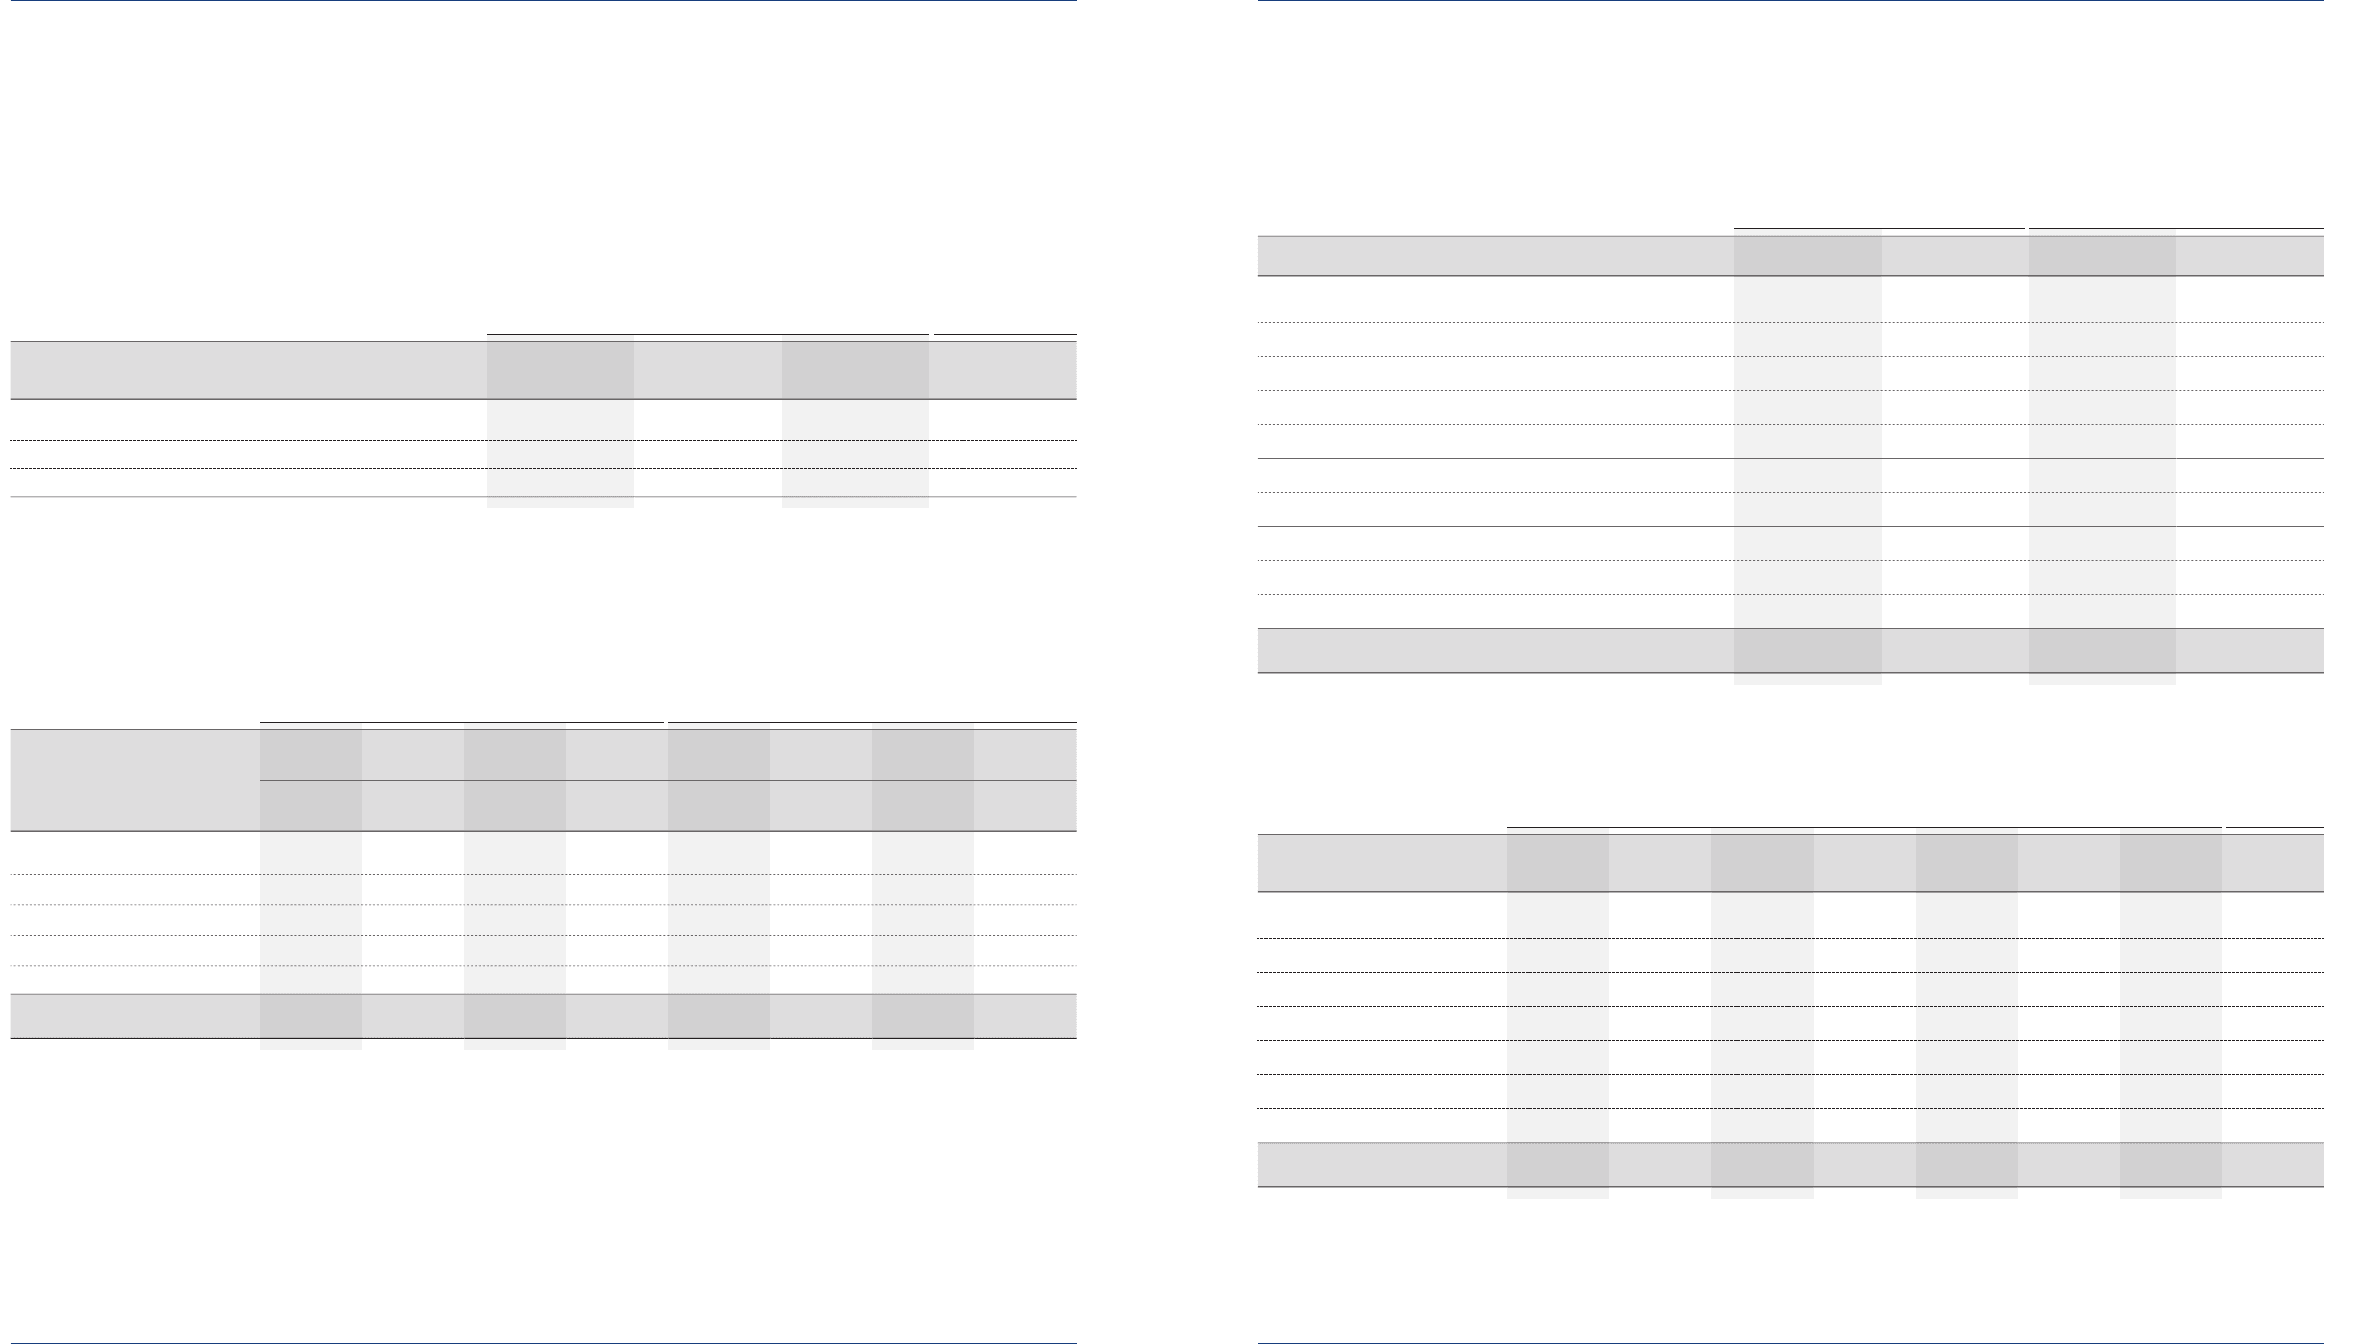
10. PROPERTY, PLANT AND EQUIPMENT:
Property, plant and equipments as of December 31, 2008 and 2007 consist of the following:
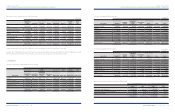
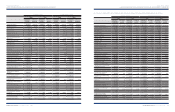
The changes in property, plant and equipment in 2008 are as follows:
(*) Other includes foreign currency adjustment, changes in the scope of consolidation, impairment loss and transfer to other assets.
Description 2008 2007 2008 2007
Buildings and structures
₩
10,574,880
₩
8,869,028 $8,409,447 $7,052,905
Machinery and equipment 18,035,439 15,482,215 14,342,297 12,311,901
Vehicles 274,745 237,741 218,486 189,058
Tools, dies and molds 6,014,935 5,260,327 4,783,249 4,183,163
Other equipment 2,062,835 1,766,788 1,640,425 1,405,000
36,962,834 31,616,099 29,393,904 25,142,027
Less : accumulated depreciation 15,541,430 13,277,036 12,358,990 10,558,279
21,421,404 18,339,063 17,034,914 14,583,748
Land 4,794,955 4,343,188 3,813,085 3,453,827
Construction in progress 2,701,902 2,947,279 2,148,630 2,343,761
₩
28,918,261
₩
25,629,530 $22,996,629 $20,381,336
Korean Won In millions U.S. Dollars (Note 2) In thousands
Beginning
of year Acquisition Transfer
Disposal Depreciation
Other (*)
End of
year
End of
year
Land
₩
4,343,188
₩
203,072
₩
174,957
₩
(6,349)
₩
-
₩
80,087
₩
4,794,955 $3,813,085
Buildings and structures 7,071,394 716,036 691,818 (9,305) (326,665) 268,871 8,412,149 6,689,582
Machinery and equipment 9,094,571 822,958 1,608,518 (118,418) (1,447,744) 380,897 10,340,782 8,223,286
Vehicles 126,140 20,189 48,232 (20,793) (40,402) 12,608 145,974 116,083
Tools, dies and molds 1,514,600 225,896 510,873 (8,996) (565,827) 41,806 1,718,352 1,366,483
Other equipment 532,358 134,456 126,634 (19,094) (207,211) 237,004 804,147 639,480
Construction in progress 2,947,279 2,844,272 (3,161,032) (92,927) -164,310 2,701,902 2,148,630
₩25,629,530 ₩4,966,879 ₩ -₩(275,882) ₩
(2,587,849)
₩1,185,583 ₩28,918,261 $22,996,629
Korean Won In millions
U.S. Dollars (Note 2)
In thousands