Hyundai 2008 Annual Report Download - page 35
Download and view the complete annual report
Please find page 35 of the 2008 Hyundai annual report below. You can navigate through the pages in the report by either clicking on the pages listed below, or by using the keyword search tool below to find specific information within the annual report.-
 1
1 -
2
-
3
-
4
-
5
-
6
-
7
-
8
-
9
-
10
-
11
-
12
-
13
-
14
-
15
-
16
-
17
-
18
-
19
-
20
-
21
-
22
-
23
-
24
-
 25
25 -
 26
26 -
 27
27 -
 28
28 -
 29
29 -
 30
30 -
 31
31 -
 32
32 -
 33
33 -
 34
34 -
 35
35 -
 36
36 -
 37
37 -
 38
38 -
 39
39 -
 40
40 -
 41
41 -
 42
42 -
 43
43 -
 44
44 -
 45
45 -
46
-
47
-
48
-
49
-
50
-
51
-
52
-
53
-
54
-
55
-
56
-
57
-
58
-
59
-
60
-
61
-
62
-
63
-
64
-
65
-
66
-
67
-
68
-
69
-
70
-
71
 |
 |

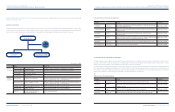
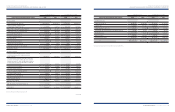
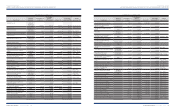
Capital
stock
Capital
surplus
Capital
adjustments
Accumulated
other
comprehensive
income(loss)
Retained
earnings
Minority
interests
Total
amount
Total
amount
January 1, 2007
₩
1,484,942
₩
5,679,998
₩
(707,045)
₩
(297,541)
₩
9,809,765
₩
4,995,854
₩
20,965,973 $16,672,742
Stock option exercised
2,038 13,552 (4,152) - - - 11,438 9,096
Disposal of
treasury stock
-17,358 - - - - 17,358 13,804
Disposal of
subsidiaries’ stock
-(8,095) - - 53,422 88,136 133,463 106,134
Increase in subsidiaries’
capital-stock
-10,871 ---156,543 167,414 133,132
Subsidiaries’ sale of
assets
-21,573 - - (24,449) 2,876 - -
Effect of changes in
consolidation scope
-----57,400 57,400 45,646
Payment of cash
dividends
----(275,373) (74,409) (349,782) (278,157)
Net income
----1,600,480 355,607 1,956,087 1,555,536
Treasury stock
- - (7,208) - - - (7,208) (5,732)
Gain on valuation of
available-for-sale
securities
---571,817 - - 571,817 454,725
Loss on valuation of
investment equity
securities
---(63,121) - - (63,121) (50,196)
Gain on overseas
operation translation
---169,091 - - 169,091 134,466
Loss on transaction of
derivatives
---(53,521) - - (53,521) (42,561)
Others
-17,746 - - 76,516 42,965 137,227 109,127
December 31, 2007
₩
1,486,980
₩
5,753,003
₩
(718,405)
₩
326,725
₩
11,240,361
₩
5,624,972
₩
23,713,636 $18,857,762
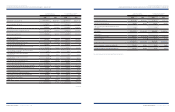
Capital
stock
Capital
surplus
Capital
adjustments
Accumulated
other
comprehensive
income(loss)
Retained
earnings
Minority
interests
Total
amount
Total
amount
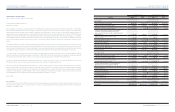
January 1, 2008
₩
1,486,980
₩
5,753,003
₩
(718,405)
₩
326,725
₩
11,240,361
₩
5,624,972
₩
23,713,636 $18,857,762
Stock option exercised
2,013 13,391 (4,612) - - - 10,792 8,582
Cancellation of
stock options
-57 (57) - - - - -
Disposal of treasury
stock
-(3,420) - - - - (3,420) (2,720)
Disposal of
subsidiaries’ stock
-76,305 ---25,760 102,065 81,165
Increase in subsidiaries’
capital-stock
-459 ---41,682 42,141 33,512
Effect of changes in
consolidation scope
-----328,888 328,888 261,541
Payment of cash
dividends (Note 23)
----(275,997) (127,646) (403,643) (320,988)
Net income
----857,751 234,801 1,092,552 868,828
Treasury stock
- - 3,839 - - - 3,839 3,053
Loss on valuation of
available-for-sale
securities
---(416,299) - - (416,299) (331,053)
Gain on valuation of
investment equity
securities
---115,760 - - 115,760 92,056
Gain on overseas
operation translation
---832,213 - - 832,213 661,800
Loss on transaction of
derivatives
---(240,090) - - (240,090) (190,926)
Others
-79 - - 19,744 153,640 173,463 137,942
December 31, 2008
₩
1,488,993
₩
5,839,874
₩
(719,235)
₩
618,309
₩
11,841,859
₩
6,282,097
₩
25,351,897 $20,160,554
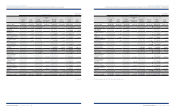
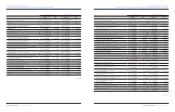
HYUNDAI MOTOR COMPANY AND SUBSIDIARIES
>>
HYUNDAI MOTOR COMPANY AND SUBSIDIARIES
>>
HYUNDAI MOTOR COMPANY I 2008 AnnuAl RepoRt I 69HYUNDAI MOTOR COMPANY I 2008 AnnuAl RepoRt I 68
(Continued) See accompanying notes to consolidated financial statements.
Korean Won in millions
U. S. Dollars (Note 2)
in thousands Korean Won in millions
U. S. Dollars (Note 2)
in thousands