Hyundai 2008 Annual Report Download - page 32
Download and view the complete annual report
Please find page 32 of the 2008 Hyundai annual report below. You can navigate through the pages in the report by either clicking on the pages listed below, or by using the keyword search tool below to find specific information within the annual report.-
 1
1 -
2
-
3
-
4
-
5
-
6
-
7
-
8
-
9
-
10
-
11
-
12
-
13
-
14
-
15
-
16
-
17
-
18
-
19
-
20
-
21
-
 22
22 -
 23
23 -
 24
24 -
 25
25 -
 26
26 -
 27
27 -
 28
28 -
 29
29 -
 30
30 -
 31
31 -
 32
32 -
 33
33 -
 34
34 -
 35
35 -
 36
36 -
 37
37 -
 38
38 -
 39
39 -
 40
40 -
 41
41 -
 42
42 -
43
-
44
-
45
-
46
-
47
-
48
-
49
-
50
-
51
-
52
-
53
-
54
-
55
-
56
-
57
-
58
-
59
-
60
-
61
-
62
-
63
-
64
-
65
-
66
-
67
-
68
-
69
-
70
-
71
 |
 |

HYUNDAI MOTOR COMPANY AND SUBSIDIARIES
>>
HYUNDAI MOTOR COMPANY AND SUBSIDIARIES
>>
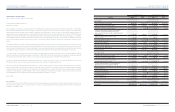
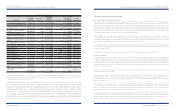
INDEPENDENT AUDITORS’ REPORT
English Translation of a Report Originally Issued in Korean
To the Shareholders and Board of Directors of
Hyundai Motor Company:
We have audited the accompanying consolidated balance sheets of Hyundai Motor Company (the “Company”) and its subsidiaries as of December 31, 2008 and 2007,
and the related consolidated statements of income, changes in shareholders’ equity and cash flows for the years then ended, all expressed in Korean Won. These
financial statements are the responsibility of the Company’s management. Our responsibility is to express an opinion on these financial statements based on our
audits. We did not audit the financial statements of certain subsidiaries including Kia Motors Corporation, which statements reflect total assets of
₩
51,272,235 million
(US$40,773,149 thousand) and
₩
40,235,279 million (US$31,996,246 thousand) as of December 31, 2008 and 2007, respectively, and total revenues of
₩
44,079,949
million (US$35,053,637 thousand) and
₩
39,742,303 million (US$31,604,217 thousand) in 2008 and 2007, respectively. Those statements were audited by other auditors
whose reports have been furnished to us, and our opinion, insofar as it relates to the amounts included for those entities, is based solely on the reports of other
auditors.
We conducted our audits in accordance with auditing standards generally accepted in the Republic of Korea. Those standards require that we plan and perform the
audit to obtain reasonable assurance about whether the financial statements are free of material misstatement. An audit includes examining, on a test basis, evidence
supporting the amounts and disclosures in the financial statements. An audit also includes assessing the accounting standards used and significant estimates made
by management, as well as evaluating the overall financial statement presentation. We believe that our audits provide a reasonable basis for our opinion.
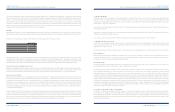
In our opinion, based on our audits and the reports of other auditors, the financial statements referred to above present fairly, in all material respects, the financial
position of Hyundai Motor Company and its subsidiaries as of December 31, 2008 and 2007, and the results of their operations, changes in its shareholders’ equity and
their cash flows for the years then ended, in conformity with accounting principles generally accepted in the Republic of Korea (See Note 2).
Our audits also comprehended the translation of Korean Won amounts into U.S. Dollar amounts and, in our opinion, such translation has been made in conformity
with the basis in Note 2. Such U.S. Dollar amounts are presented solely for the convenience of readers outside of Korea.
Accounting principles and auditing standards and their application in practice vary among countries. The accompanying financial statements are not intended to
present the financial position, results of operations, changes in shareholders’ equity and cash flows in accordance with accounting principles and practices generally
accepted in countries other than the Republic of Korea. In addition, the procedures and practices utilized in the Republic of Korea to audit such financial statements
may differ from those generally accepted and applied in other countries. Accordingly, this report and the accompanying financial statements are for use by those
knowledgeable about Korean accounting procedures and auditing standards and their application in practice.
March 24, 2009
Notice to Readers
This report is effective as of March 24, 2009, the auditors’ report date. Certain subsequent events or circumstances may have occurred between the auditors’ report
date and the time the auditors’ report is read. Such events or circumstances could significantly affect the accompanying financial statements and may result in
modifications to the auditors’ report.
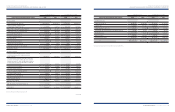
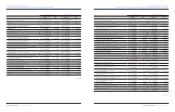
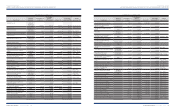
ASSETS 2008 2007 2008 2007
Current assets:
Cash and cash equivalents (Note 9)
₩
6,218,218
₩
4,393,692 $4,944,905 $3,493,990
Short-term financial instruments (Note 3) 3,369,071 3,344,206 2,679,182 2,659,408
Short-term investment securities (Note 5) 1,065,429 142,814 847,260 113,570
Trade notes and accounts receivable, less allowance
for doubtful accounts and present value discount
account of
₩
247,539 million in 2008 and
₩
202,492million
in 2007(Note 16) 6,687,501 6,308,361 5,318,092 5,016,589
Trade notes and accounts receivable - other
(Notes 16 and 25) 975,218 177,587 775,521 141,222
Inventories (Notes 4, 9 and 24) 16,855,998 11,265,083 13,404,372 8,958,317
Derivative assets (Note 29) 67,494 18,760 53,673 14,918
Deferred tax assets (Note 22) 1,163,042 797,520 924,884 634,211
Advances and other current assets 2,372,417 1,741,265 1,886,614 1,384,704
Total current assets 38,774,388 28,189,288 30,834,503 22,416,929
Non-current assets:
Long-term financial instruments (Note 3) 12,571 5,539 9,997 4,405
Long-term investment securities (Note 6) 1,075,254 1,492,399 855,073 1,186,798
Investment securities accounted for using
the equity method (Notes 7 and 16) 2,702,336 2,035,078 2,148,975 1,618,352
Property, plant and equipment, net of accumulated
depreciation of
₩
15,541,430 million in 2008 and
₩
13,277,036 million in 2007 (Notes 8, 9, 10, 16 and 24) 28,918,261 25,629,530 22,996,629 20,381,336
Intangibles (Note 11) 3,448,857 2,997,884 2,742,630 2,384,003
Derivative assets (Note 29) 1,928,165 259,656 1,533,332 206,486
Deferred tax assets (Note 22) 689,650 610,799 548,429 485,725
Other assets (Note 12) 1,457,922 1,093,401 1,159,381 869,504
Total non-current assets 40,233,016 34,124,286 31,994,446 27,136,609
Other financial business assets (Notes 13 and 16) 24,198,379 21,533,952 19,243,244 17,124,415
Total assets
₩
103,205,783
₩
83,847,526 $82,072,193 $66,677,953
HYUNDAI MOTOR COMPANY I 2008 AnnuAl RepoRt I 63HYUNDAI MOTOR COMPANY I 2008 AnnuAl RepoRt I
Korean Won in millions U. S. Dollars (Note 2) in thousands