Hyundai 2008 Annual Report Download - page 55
Download and view the complete annual report
Please find page 55 of the 2008 Hyundai annual report below. You can navigate through the pages in the report by either clicking on the pages listed below, or by using the keyword search tool below to find specific information within the annual report.-
 1
1 -
2
-
3
-
4
-
5
-
6
-
7
-
8
-
9
-
10
-
11
-
12
-
13
-
14
-
15
-
16
-
17
-
18
-
19
-
20
-
21
-
22
-
23
-
24
-
25
-
26
-
27
-
28
-
29
-
30
-
31
-
32
-
33
-
34
-
35
-
36
-
37
-
38
-
39
-
40
-
41
-
42
-
43
-
44
-
 45
45 -
 46
46 -
 47
47 -
 48
48 -
 49
49 -
 50
50 -
 51
51 -
 52
52 -
 53
53 -
 54
54 -
 55
55 -
 56
56 -
 57
57 -
 58
58 -
 59
59 -
 60
60 -
 61
61 -
 62
62 -
 63
63 -
 64
64 -
 65
65 -
66
-
67
-
68
-
69
-
70
-
71
 |
 |

HYUNDAI MOTOR COMPANY
>>
HYUNDAI MOTOR COMPANY
>>
HYUNDAI MOTOR COMPANY I 2008 AnnuAl RepoRt I HYUNDAI MOTOR COMPANY I 2008 AnnuAl RepoRt I
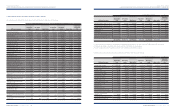
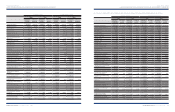
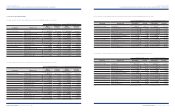
Description
Accumulated
temporary
differences
Deferred
tax assets
(liabilities)
Accumulated
temporary
differences
Deferred
tax assets
(liabilities)
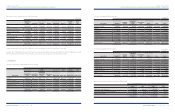
Accumulated temporary differences
₩
1,767,798
₩
381,972 $1,405,804 $303,755
Carry over tax deduction 439,542 443,936 349,536 353,031
₩
2,207,340
₩
825,908 $1,755,340 $656,786
Korean Won In millions U.S. Dollars (Note 2) In thousands
The temporary differences of
₩
263,723 million (US$209,720 thousand) and
₩
218,889 million (US$174,067 thousand) as of December 31, 2008 and 2007, respectively,
were not recognized since it is not probable that the temporary difference will be reversed in the foreseeable future.
The Company believes average taxable income in the coming years will exceed the amount of deferred taxes to be realized every year based on its assessment. The
tax rate used in calculating deferred tax assets or liabilities arising from temporary differences is 24.2% (tax rate used in calculating deferred tax assets or liabilities
which are realized after 2010 is 22%) including resident tax.
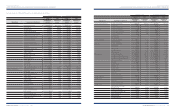
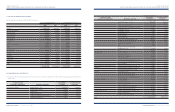
Number of
shares Dividend rate
Korean Won
In millions
U.S. Dollars
(Note 2)
In thousands
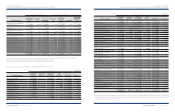
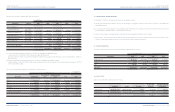
Common shares, net of treasury shares 209,244,738 17%
₩
177,859 $141,439
Preferred shares, net of treasury shares:
First and Third preferred shares 25,637,321 18% 23,073 18,348
Second preferred shares 36,613,865 19% 34,783 27,660
₩
235,715 $187,447
Number of
shares Dividend rate
Korean Won
In millions
U.S. Dollars
(Note 2)
In thousands
Common shares, net of treasury shares 208,802,067 20%
₩
208,802 $166,045
Preferred shares, net of treasury shares:
First and Third preferred shares 25,637,321 21% 26,919 21,407
Second preferred shares 36,613,865 22% 40,275 32,028
₩
275,996 $219,480
23. DIVIDENDS:
The computation of the proposed dividends for 2008 is as follows:
The payout ratios (dividends declared/net income) are 27.5% and 17.2% for the years ended December 31, 2008 and 2007, respectively.
The computation of the proposed dividends for 2007 is as follows:
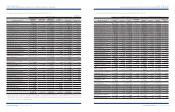
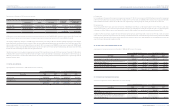
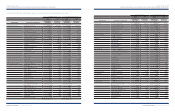
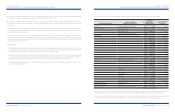
24. ELIMINATION OF UNREALIZED PROFITS AND LOSSES:
Unrealizedprofitsandlossesresultingfromsalesamongconsolidatedsubsidiariesarecalculatedbasedontheaveragegrossmarginrateofsellingcompaniesand
areeliminatedintheconsolidatedfinancialstatements.
Unrealizedprofitsandlossesrelatedtosalesofinventoriesandproperty,plantandequipmentin2008areasfollows:
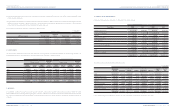
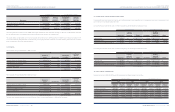
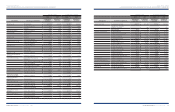
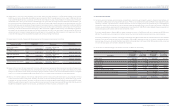
Significant transactions in 2008 and 2007 between the Company and consolidated subsidiaries are as follows:
Unrealized profits and losses related to sales of inventories and property, plant and equipment in 2007 are as follows:
Inventories
Property,
plant and
equipment Others Inventories
Property,
plant and
equipment Others
Upstream sales
₩
5,641
₩
-
₩
-$4,486 $ - $ -
Downstream sales 760,538 177,669 (231,248) 604,802 141,287 (183,895)
Sales between consolidated subsidiaries 350,594 10,100 (71,909) 278,802 8,032 (57,184)
Inventories
Property,
plant and
equipment Others Inventories
Property,
plant and
equipment Others
Upstream sales
₩
3,999
₩
-
₩
-$3,180 $ - $ -
Downstream sales 145,202 129,366 (41,074) 115,469 102,876 (32,663)
Sales between consolidated subsidiaries 198,826 7,678 (38,044) 158,112 21,397 (30,254)
Korean Won In millions
Korean Won In millions
U.S. Dollars (Note 2) In thousands
U.S. Dollars (Note 2) In thousands
2008 2007 2008 2007
Company’s
income
Company’s
expenses
Company’s
income
Company’s
expenses
Company’s
income
Company’s
expenses
Company’s
income
Company’s
expenses
Kia Motors Corporation
₩
819,709
₩
200,651
₩
870,101
₩
423,335 $651,856 $159,563 $691,929 $336,648
Hyundai Capital Service Inc. 687,693 40,285 518,536 41,708 546,873 32,036 412,355 33,167
WIA Corporation 154,000 334,713 207,880 264,036 122,465 266,173 165,312 209,969
Dymos Inc. 620 444,376 1,020 512,921 493 353,381 811 407,889
Hyundai HYSCO 2,277 228,899 4,020 240,511 1,811 182,027 3,197 191,261
Korean Won In millions U.S. Dollars (Note 2) In thousands