Hyundai 2008 Annual Report Download - page 34
Download and view the complete annual report
Please find page 34 of the 2008 Hyundai annual report below. You can navigate through the pages in the report by either clicking on the pages listed below, or by using the keyword search tool below to find specific information within the annual report.-
 1
1 -
2
-
3
-
4
-
5
-
6
-
7
-
8
-
9
-
10
-
11
-
12
-
13
-
14
-
15
-
16
-
17
-
18
-
19
-
20
-
21
-
22
-
23
-
 24
24 -
 25
25 -
 26
26 -
 27
27 -
 28
28 -
 29
29 -
 30
30 -
 31
31 -
 32
32 -
 33
33 -
 34
34 -
 35
35 -
 36
36 -
 37
37 -
 38
38 -
 39
39 -
 40
40 -
 41
41 -
 42
42 -
 43
43 -
 44
44 -
45
-
46
-
47
-
48
-
49
-
50
-
51
-
52
-
53
-
54
-
55
-
56
-
57
-
58
-
59
-
60
-
61
-
62
-
63
-
64
-
65
-
66
-
67
-
68
-
69
-
70
-
71
 |
 |

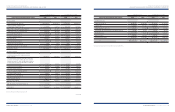
HYUNDAI MOTOR COMPANY AND SUBSIDIARIES
>>
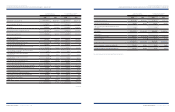
HYUNDAI MOTOR COMPANY AND SUBSIDIARIES
>>
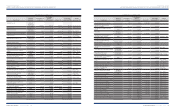
HYUNDAI MOTOR COMPANY I 2008 AnnuAl RepoRt I HYUNDAI MOTOR COMPANY I 2008 AnnuAl RepoRt I 66
2008 2007 2008 2007
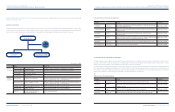
Sales (Notes 24, 25, 26 and 30)
₩
79,736,351
₩
69,601,516 $63,408,629 $55,349,118
Cost of sales (Notes 25 and 26) 61,829,549 55,467,476 49,168,627 44,109,325
Gross profit 17,906,802 14,134,040 14,240,002 11,239,793
Selling and administrative expenses (Note 27) 14,834,759 11,286,018 11,797,025 8,974,965
Operating income (Note 30) 3,072,043 2,848,022 2,442,977 2,264,828
Other income (expenses), net:
Interest expense, net (233,997) (430,631) (186,081) (342,450)
Loss on foreign exchange translation, net (2,354,804) (169,640) (1,872,608) (134,903)
Gain (loss) on foreign exchange, net (744,407) 42 (591,974) 33
Gain on valuation of investment securities accounted
for using the equity method, net 356,972 281,603 283,874 223,939
Gain on disposal of investment securities accounted
for using the equity method 2,025 4,484 1,611 3,566
Gain on disposal of short-term investment
securities, net 1,215 30,621 966 24,351
Gain on disposal of long-term investment
securities, net 38,452 35,959 30,578 28,596
Gain (loss) on valuation of derivatives, net 1,790,314 (25,295) 1,423,709 (20,115)
Loss on derivatives transaction, net (119,406) -(94,955) -
Loss on disposal of trade notes and accounts receivable (253,905) (245,164) (201,913) (194,961)
Loss on disposal of property, plant and equipment, net (61,389) (11,706) (48,818) (9,309)
Rental and royalty income 113,682 47,670 90,403 37,909
Loss on impairment of investment securities (5,481) (1,964) (4,359) (1,562)
Impairment loss on property, plant and equipment (33,966) (79) (27,011) (63)
Impairment loss on intangibles (2,747) (1,114) (2,184) (886)
Other, net (67,617) 246,012 (53,771) 195,635
(1,575,059) (239,202) (1,252,533) (190,220)
2008 2007 2008 2007
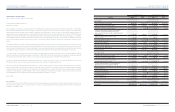
Income before income tax
₩
1,496,984
₩
2,608,820 $1,190,444 $2,074,608
Income tax expense (Note 22) 409,919 652,733 325,979 519,072
Net loss of newly consolidated subsidiaries before
acquisition 5,487 -4,363 -
Net income
₩
1,092,552
₩
1,956,087 $868,828 $1,555,536
Attributable to:
Equity holders of the parent
₩
857,751
₩
1,600,480 $682,108 $1,272,748
Minority interests 234,801 355,607 186,720 282,788
₩
1,092,552
₩
1,956,087 $868,828 $1,555,536
Basic earnings per common share (Note 2)
₩
2,499
₩
5,813 $1.99 $4.62
Diluted earnings per common share (Note 2)
₩
2,497
₩
5,800 $1.99 $4.61
See accompanying notes to consolidated financial statements.
(Continued)
Korean Won in millions
except per share amounts
U. S. Dollars (Note 2) in thousands
except per share amounts
Korean Won in millions
except per share amounts
U. S. Dollars (Note 2) in thousands
except per share amounts