Hyundai 2008 Annual Report Download - page 54
Download and view the complete annual report
Please find page 54 of the 2008 Hyundai annual report below. You can navigate through the pages in the report by either clicking on the pages listed below, or by using the keyword search tool below to find specific information within the annual report.-
 1
1 -
2
-
3
-
4
-
5
-
6
-
7
-
8
-
9
-
10
-
11
-
12
-
13
-
14
-
15
-
16
-
17
-
18
-
19
-
20
-
21
-
22
-
23
-
24
-
25
-
26
-
27
-
28
-
29
-
30
-
31
-
32
-
33
-
34
-
35
-
36
-
37
-
38
-
39
-
40
-
41
-
42
-
43
-
 44
44 -
 45
45 -
 46
46 -
 47
47 -
 48
48 -
 49
49 -
 50
50 -
 51
51 -
 52
52 -
 53
53 -
 54
54 -
 55
55 -
 56
56 -
 57
57 -
 58
58 -
 59
59 -
 60
60 -
 61
61 -
 62
62 -
 63
63 -
 64
64 -
65
-
66
-
67
-
68
-
69
-
70
-
71
 |
 |

HYUNDAI MOTOR COMPANY
>>
HYUNDAI MOTOR COMPANY
>>
HYUNDAI MOTOR COMPANY I 2008 AnnuAl RepoRt I HYUNDAI MOTOR COMPANY I 2008 AnnuAl RepoRt I
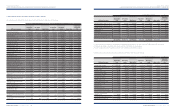
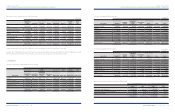
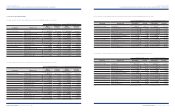
Description 2008 2007 2008 2007
Income tax currently payable
₩
707,153
₩
848,494 $562,348 $674,747
Changes in deferred taxes due to:
Temporary differences (615,668) 98,953 (489,597) 78,690
Carry forward of unused tax credits 43,111 (27,206) 34,283 (21,635)
Change in consolidated subsidiaries (14,539) -(11,562) -
Items directly charged to equity 289,862 (267,508) 230,507 (212,730)
Income tax expense
₩
409,919
₩
652,733 $325,979 $519,072
Description 2008 2007 2008 2007
Gain (loss) on valuation of investment securities accounted for
using the equity method, net of deferred tax effect
₩
(63,152)
million and
₩
14,267 million in 2008 and 2007, respectively. 115,760 (63,121) 92,056 (50,196)
Loss on valuation of derivatives, net of deferred tax effect
₩
73,239 million and
₩
20,301 million in 2008 and 2007,
respectively. (240,090) (53,521) (190,925) (42,561)
Gain on overseas operation translation, net of deferred tax
effect
₩
(262,509) million and
₩
(64,138) million in 2008 and
2007, respectively. 832,213 169,091 661,799 134,467
Comprehensive income
₩
1,384,136
₩
2,580,353 $1,100,705 $2,051,971
Equity holders of the parent
₩
1,149,335
₩
2,224,746 $913,985 $1,769,183
Minority interests
₩
234,801
₩
355,607 $186,720 $282,788
Korean Won In millions
Korean Won In millions
U.S. Dollars (Note 2) In thousands
U.S. Dollars (Note 2) In thousands
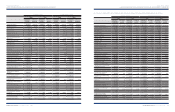
Income tax expense in 2008 and 2007 consists of the following:
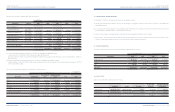
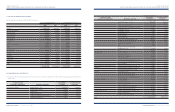
Description 2008 2007 2008 2007
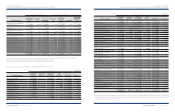
Income tax expense
₩
409,919
₩
652,733 $325,979 $519,072
Income before income tax expenses 1,496,984 2,608,820 1,190,444 2,074,608
Effective tax rates 27.38% 25.02% 27.38% 25.02%
Korean Won In millions U.S. Dollars (Note 2) In thousands
Effective tax rates in 2008 and 2007 are as follows:
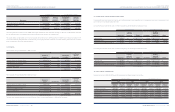
Description
Accumulated
temporary
differences
Deferred
tax assets
(liabilities)
Accumulated
temporary
differences
Deferred
tax assets
(liabilities)
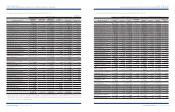
Accrued warranties
₩
4,470,609
₩
1,161,845 $3,555,156 $923,932
Long-term investment securities (56,647) (92,111) (45,047) (73,249)
Allowance for doubtful accounts 660,558 168,274 525,295 133,816
Other non-current assets (2,362,253) (498,287) (1,878,531) (396,252)
Reserve for research and manpower development (383,122) (82,890) (304,670) (65,917)
Derivative liabilities (1,297,230) (275,969) (1,031,594) (219,458)
Development cost (17,542) (6,178) (13,950) (4,913)
Depreciation (1,440,540) (446,552) (1,145,559) (355,111)
Accrued income (136,897) (33,105) (108,864) (26,326)
Advanced depreciation provisions (509,768) (2,377) (405,382) (1,890)
Gain on foreign exchange translation 2,019,944 482,396 1,606,317 383,615
Provision for other liabilities 397,532 88,572 316,129 70,435
Other 1,678,008 534,022 1,334,399 424,670
Accumulated temporary differences 3,022,652 997,640 2,403,699 793,352
Carry over tax deduction 403,260 400,825 320,684 318,747
₩
3,425,912
₩
1,398,465 $2,724,383 $1,112,099
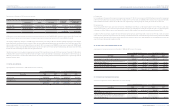
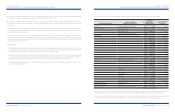
Description
Accumulated
temporary
differences
Deferred
tax assets
(liabilities)
Accumulated
temporary
differences
Deferred
tax assets
(liabilities)
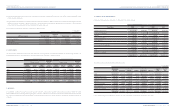
Accrued warranties
₩
4,063,389
₩
1,138,700 $3,231,323 $905,527
Long-term investment securities (825,616) (323,560) (656,553) (257,304)
Allowance for doubtful accounts 503,244 139,618 400,194 111,028
Other non-current assets (2,932,463) (1,017,114) (2,331,979) (808,838)
Reserve for research and manpower development (376,993) (96,250) (299,796) (76,541)
Derivative assets 443,868 123,142 352,977 97,926
Development cost 38 930 7
Depreciation (368,282) (103,848) (292,868) (82,583)
Accrued income (85,128) (23,394) (67,696) (18,604)
Dividends 7,745 2,130 6,159 1,694
Advanced depreciation provisions (509,692) (2,972) (405,322) (2,363)
Other 1,847,688 545,511 1,469,334 433,806
Korean Won In millions
Korean Won In millions
U.S. Dollars (Note 2) In thousands
U.S. Dollars (Note 2) In thousands
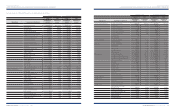
The components of accumulated temporary differences and deferred tax assets (liabilities) as of December 31, 2008 are as follows:
The components of accumulated temporary differences and deferred tax assets (liabilities) as of December 31, 2008 are as follows: